
Commodities Futures
Indicative Commodities prices from Finspreads:
Click on the tabs to see the various commodities, forex and stock market index prices.
|
|
|
Commodities Futures Analysis and News
|
| 20-May-18 |
[12:56pm] New Commodities COT Reports
The latest Commitments of Traders Report (COT) has been published by the CFTC and so we have produced a new Commodities COT Summary Report.
We have also added individual COT reports for the markets listed below. We feel our reports are easier-to-read than the CFTC version, they also have additional ratios and show the weekly net positions changes.
| Metals COT Reports: | Energies COT Reports: | Softs COT Reports: | | | |
Note that the Commodities COT Summary Report also includes Rough Rice and Oats.
Update by Gordon Childs, Editor, 
|
| 13-May-18 |
[8:17pm] New Commodities COT Reports
The latest Commitments of Traders Report (COT) has been published by the CFTC and so we have produced a new Commodities COT Summary Report.
We have also added individual COT reports for the markets listed below. We feel our reports are easier-to-read than the CFTC version, they also have additional ratios and show the weekly net positions changes.
| Metals COT Reports: | Energies COT Reports: | Softs COT Reports: | | | |
Note that the Commodities COT Summary Report also includes Rough Rice and Oats.
Update by Gordon Childs, Editor, 
|
For more also see Daily Commodities Trading Analysis & News.
Commodities Futures Comparison |
A price comparison table for the most popular commodities futures markets.
| Gold Daily |
4 |
3 |
4 |
4 |
| Gold Future |
4† |
6 |
6 |
5 |
| Brent Crude Oil Daily |
3† |
7† |
4 |
3.5 |
| Brent Crude Oil Future |
3 |
7 |
6 |
4 |
| US Crude Oil Daily |
3† |
4† |
4 |
3.5 |
| US Crude Oil Future |
3 |
4 |
6 |
4 |
| Commodities Minimum Stake |
£1 |
£1 |
£0.5 |
£1 |
Comparison Notes.
This table is not meant to be inclusive, daily commodities and commodities futures markets may be available through other companies.
Where to Trade Commodities Futures |
Investors can speculate on a range of commodities futures like gold, crude oil, sugar and coffee with these spread trading firms:
Financial Spreads » "With FinancialSpreads.com you get all the advantages of
Spread Trading as well as commission free CFD Trading on 2,500+ markets, 24 hour trading, professional level charts and..." read
Financial Spreads review.
|
Where to Trade Commodities Futures for Free? |
Futures trading is never risk free, however, if you want to open a free Practice Account, where you can try spread trading / trading the futures markets, then please see below for more details.
When you start to research which investment options are right for you, don't forget that in the UK, financial spread trading is tax free*, i.e. it's currently exempt from capital gains tax, income tax and stamp duty.
If you are looking for a free futures trading platform then you should keep in mind that the following firms offer futures markets but do not charge any commissions or brokers' fees:
If you're looking for a free Test Account that lets users practice trading the commodity markets including crude oil, gold, natural gas, wheat, sugar, coffee etc., then look at:
Each of the brokers listed above offer a Test Account that lets investors try out new trading theories. The Test Accounts also give users access to professional level charts.
Where to Find Live Commodities Futures Prices and Charts |
The live CFD futures chart and prices below will offer users a good overview of the commodity markets.
You can use the search option below to access live futures charts for:
- Energy Futures: US crude oil‡, heating oil and natural gas
- Metal Futures: gold, copper, palladium, platinum and silver
- Agricultural Futures: corn, cotton and soybeans
‡ Readers should note that the 'crude oil' market is US crude oil rather than UK crude oil.
The Plus500 chart typically tracks the 'front month' futures market.
To review live spread trading prices and charts for the commodities futures markets, you will normally need a spread trading account.
Note that a spreads account is tax-free* and also gives you access to the shorter-term spot prices. Readers should note that new accounts are subject to status, suitability and credit checks.
If you apply for an account (and it's approved) then you should be able to log on and check the real time charts and prices. Accessing this data is usually free.
If you want to trade then you should note that CFD trading and financial spread trading carry a high degree of risk to your capital and losses could exceed your initial deposit.
Advanced Charts for Trading Commodities Futures |
Although the charting packages tend to vary between firms, to help your technical analysis of the commodities markets, most charts usually come with handy tools and features, including:
- Technical indicators and overlays such as Moving Averages, MACD, TSI, RSI etc.
- An array of time intervals such as 1 minute, 5 minute, 10 minute, 1 hour, 2 hour, 1 week etc.
- Drawing options and tools such as Fibonacci arcs, time zones and fans
- A variety of display styles such as bar, candlestick and line charts
The charts with Tradefair also include other benefits such as:
- Email notifications for when the markets reach a pre-determined price
- Back Testing, Analysis and Optimisation functions
Typical commodities futures chart
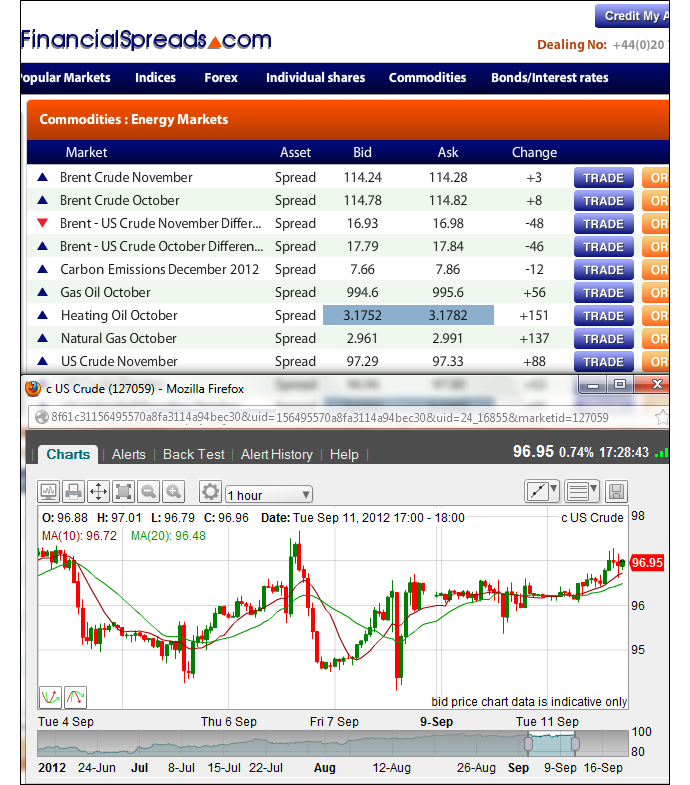
The following futures brokers provide their clients with access to live prices and charts:
Commodities Futures Guides |
For individual guides to the various commodities futures markets also see:
Metals Futures:
Energies Futures:
Agriculturals / Softs Futures

How to Trade Commodities - Gold Futures |
As with a number of metals markets, you can speculate on gold futures to rise or fall.
If you go to Financial Spreads, you can see that they are currently pricing the gold December futures market at $1,757.3 - $1,757.9. This means you can speculate on gold:
 Closing above $1,757.9, or Closing above $1,757.9, or
 Closing below $1,757.3 Closing below $1,757.3
On the expiry date for this 'December' market, 27-Nov-12.
With spread trading, you trade gold in £x per $0.1. So, if you decide to stake £3 per $0.1 and gold moves $2.7 then that would make a difference to your profit/loss of £81. £3 per $0.1 x $2.7 = £81.
Gold Futures Trading Example |
Continuing with the above spread of $1,757.3 - $1,757.9, let's make the assumptions:
- You have researched the precious metals market, and
- You think that the gold market will finish above $1,757.9 by 27-Nov-12
If so, you could decide to go long of the market at $1,757.9 and risk, let's say, £2 per $0.1.
With this trade you make a profit of £2 for every $0.1 that the price of gold moves higher than $1,757.9. Nevertheless, this trade also means that you will make a loss of £2 for every $0.1 that gold falls below $1,757.9.
Or, in other words, when you 'Buy' a market, your P&L is calculated by taking the difference between the closing price of the market and the opening price you bought the market at. You then multiply that price difference by the stake.
As a result, if, on the expiry date, gold closed at $1,763.2, then:
Profit = (Closing Level - Opening Level) x stake
Profit = ($1,763.2 - $1,757.9) x £2 per $0.1
Profit = $5.3 x £2 per $0.1
Profit = £106 profit
Trading the precious metals market is rarely that simple. In the above example, you wanted the price of the commodity to rise, of course it could fall.
If the price of the metal fell and the market closed lower at $1,751.7, then you would end up making a loss.
Loss = (Closing Level - Opening Level) x stake
Loss = ($1,751.7 - $1,757.9) x £2 per $0.1
Loss = -$6.2 x £2 per $0.1
Loss = -£124 loss
Note: Gold December futures market quoted as of 27-Sep-12.
How to Trade Commodities - Crude Oil Futures |
As with the gold example above, you can also speculate on energies futures.
Two of the most popular energies markets are Brent crude oil futures and US crude oil futures, in this example we will talk through the latter market.
If we log on to Capital Spreads, we can see that they are offering the US crude oil November futures market at $90.97 - $91.02. This means you can speculate on the price of US crude oil:
 Closing above $91.02, or Closing above $91.02, or
 Closing below $90.97 Closing below $90.97
On the settlement date for this 'November' market, 17-Oct-12.
With spread trading, you trade US crude oil in £x per $0.01. As a result, if you want to trade £2 per $0.01 and the US crude oil market moves $0.40 then that would alter your P&L by £80. £2 per $0.01 x $0.40 = £80.
US Crude Oil Futures Trading Example |
So, continuing with the above spread of $90.97 - $91.02, let's make the assumptions:
- You have done your research of the energies markets
- You think the oil price will remain strong and it will close above $91.02 by 17-Oct-12
If so, then you could buy the market at $91.02 and trade, for example, £3 per $0.01.
With this trade you make a profit of £3 for every $0.01 that the price of US crude moves higher than $91.02. Having said that, it also means you will lose £3 for every $0.01 that the US crude market drops below the $91.02 level.
Put another way, if you 'Buy' a market then your profits (or losses) are calculated by taking the difference between the expiry price of the market and the price you bought the market at. You then multiply that difference in price by the stake.
With that in mind, if, on the closing date, US crude closed at $91.50, then:
P&L = (Closing Price - Opening Price) x stake
P&L = ($91.50 - $91.02) x £3 per $0.01
P&L = $0.48 x £3 per $0.01
P&L = £144 profit
Trading any commodities futures market is difficult. With this example, you wanted the oil price to increase, of course, the oil market could fall.
If US crude had fallen and closed lower at $90.59, you would end up making a loss.
P&L = (Closing Price - Opening Price) x stake
P&L = ($90.59 - $91.02) x £3 per $0.01
P&L = -$0.43 x £3 per $0.01
P&L = -£129 loss
Note: US crude oil November futures price quoted as of 27-Sep-12.
Financial Spreads » "With FinancialSpreads.com you get all the advantages of
Spread Trading as well as commission free CFD Trading on 2,500+ markets, 24 hour trading, professional level charts and..." read
Financial Spreads review.
|
Quick Guide to Commodities Futures |
This guide from Finspreads is designed to broaden your knowledge of the commodities markets.
Commodities are some of the most volatile and unpredictable products on which a trader can spread bet.
A wide variety of influences, from political developments to the weather forecast, can dramatically affect commodity prices in the spread betting markets. For this reason, it is vital that you understand commodities in detail before you start spread betting on them.
What are Commodities?
In their essence, commodities such as gold, oil and wheat are goods which are interchangeable in any part of the world.
For example, a barrel of crude oil would be worth the same whether bought in the UK or the USA. This is what sets commodities apart from products such as wine and cheese, which come in a variety of strengths, flavours, ingredients and so on, and consequently can vary greatly.
Why are Commodities so Volatile?
As with many other products in the financial markets, supply and demand force prices up or down, and the commodities markets are also significantly influenced by crop reports, weather forecasts, political announcements and seasonal factors.
What makes commodities even more challenging from a spread betting point of view is that, a lot of the time, the news affecting them tends to follow the price movement, rather than the other way around. This makes effective risk management a crucial element of commodities spread trading.
Risk Management
Technical analysis can help you to assess just how volatile a commodity market can be before you risk any capital.
Analyse some historical charts to see how wide the price bands it moves through tend to be. You can also manage your potential downsides in commodity spread betting by using guaranteed stop losses. These guarantee to close your spread bet at a precise trigger value without limiting your profit potential, incurring a small premium for doing so.
Alternatively, some spread bettors - those starting out with a limited balance, for example - simply choose to avoid commodities altogether and instead focus their spread betting on less volatile markets such as equities or indices.
Whatever you choose to spread bet on, always make sure that you fully understand the risks beforehand.
Using Technical Analysis on Commodities Futures |
Below, an older but still useful commodities futures case study by Shai Heffetz, InterTrader, 26-May-2011.
Gold Futures Technical Analysis
Gold is in a long term bull run of which there is no proof that the end is in sight. The weakness of the dollar has further strengthened the demand for gold as an alternative safe haven for investors.
Looking at the gold chart below we see the price took a temporary dip in February, but emerged from the Ichimoku Kinko Hyo cloud again on 21 February.
Since then it has broken through the support level provided by the blue Kijun-Sen line twice, only to proceed with its uptrend shortly afterwards.
Right now the gold price is above the red Tenkan-Sen line, but still below the blue Kijun-Sen. A cautious trader should therefore wait for the price to break through the blue Kijun-Sen before going long.
It would also be advisable to wait until the chart also shows the red Tenkan-Sen breaking through the blue Kijun-Sen, indicating that the short term correction is over.
Silver Futures Technical Analysis
The silver spread betting market is currently either moving into a bear market, or it is going through a major correction.
If we consider the silver technical analysis of the chart below we see that the price broke out of the Ichimoku Kinko Hyo cloud on 8 February and subsequently closed at a high of $48.475 on 28 April.
After that it started to decline. First it broke through the red Tenkan-Sen line and then through the blue Kijun Sen support line. After that nothing could stop the downward spiral and, on 5 May, it closed below the top line of the Ichimoku cloud.
Between the 6 and 10 of May there was a temporary attempt to resume the previous upswing. However, this faltered and on the 23rd of May it was trading below the Ichimoku Kinko Hyo cloud, a clear indication that the market might have moved into a bear phase.
The green Chinkou Span line is also below the price of 26 days ago, which further strengthens the perception of a bear market. The red Tenkan-Sen is also well below the blue Kijun-Sen, another confirmation that the bull run is over for now.
If the price should move below the level of $32.955 it briefly reached on 17 May, traders can start thinking of entering into short trades.
Brent Crude Oil Futures Technical Analysis
Before 5 May 2011, Brent crude oil was in a clear bull run from a crude oil technical analysis point of view.
We then had two days of what looked like a minor correction, but on 5 May the price suddenly dropped from $121.03 to $109.66.
It attempted to regain some momentum afterwards, but the downward pressure was too much and it subsequently nosedived into the Ichimoku Kinko Hyo cloud.
At the moment the price is well below the cloud. The green Chinkou Span line is also below the price 26 periods ago and the red Tenkan-Sen is below the blue Kijou-Sen, another confirmation that the price has moved into a, possibly temporary, declining phase.
Strong believers in the effectiveness of the Ichimoku Kinko Hyo to indicate market trends should no doubt now go short of Brent futures. Itís early days, however, and if you are a cautious trader you should perhaps wait for more confirmation of a bear market.
This can be provided if the blue Kijun-Sen also drops below the Ichimoku cloud. At the moment it has turned horizontal, indicating some market uncertainty.
Also see our trading guide to Ichimoku clouds.
Trading 'Soft' Commodities |
Below, an older but still commodities futures article by Michael Hewson, CMC Markets, 26-July-2012.
There is a buzz around soft commodities at the moment; largely focussed on corn, wheat, soy bean and the price volatility of those markets.
Soft Commodities, Weather and the Arab Spring
Seasonal factors have always been a big driver of food prices, particularly in recent years where floods, drought and other natural events have seen sharp moves up, as well as down, in soft commodity prices.
Case in point, corn prices in the last 3 weeks have jumped 50% to their highest levels in 10 years, as has soybean meal prices.
Last yearís Arab Spring has in part been attributed to sharp rises in sugar, wheat and corn prices, which prompted widespread protests across the Middle East and Africa.
Populations are becoming increasingly frustrated at corruption on the part of governments, and rising food prices tend to be the straw that breaks the camelís back.
Disaffection is now spreading from emerging markets where food staples make up a much higher percentage of disposable income to more developed economies where money printing by central banks is having the unintended consequence of also pushing commodity prices higher.
Since 2008, the prices of food staples like corn, wheat - and to a lesser extent soybean - have fluctuated wildly, as they have doubled as well as halved in price.
This volatility has been largely driven by seasonal factors and wild weather, though politicians would like people to think that speculation plays a large part as well simply because it diverts attention away from their own inadequacies and policy failures.
Soft Commodities: Emerging Markets
Part of the problem has been the scarcity of arable land set against rising food needs through the rise of a growing middle class in emerging market economies.
The growth in countries like Brazil, India and China will likely see demand for these food staples rise in the coming years. Governments will have to make hard decisions about how they meet the needs of their populations in a world that appears to be growing rapidly, while susceptible to ever growing extreme weather events.
Since 2008 extreme weather events have become more of a norm with proponents of climate change urging world leaders to develop new methods to decrease the worldís reliance on fossil fuels.
Soft Commodities Trading: Biofuel Production with Corn
Unfortunately some of these new methods are part of the problem certainly with respect to the use of corn. The use of biofuels as an alternative fuel source has had a marked effect on demand for corn.
According to a study two years ago by the Earth Policy Institute, 15% of US corn production is set aside for biofuel production and the amount of grain required to fill a petrol tank of an SUV is sufficient to feed one person for one year.
Politicians will have to push back on their green lobby by asking whether this particular trade-off is acceptable in a world where over 1 billion people in the world go to bed hungry every single night.
Corn Futures
Set against this background and the fact that corn is also used as feed for cattle, it is not hard to see why food price shocks are likely to become a fact of life from here on in. This come as supply chains get tighter and tighter and arable land becomes more sought after.
This yearís drought in the US, the worst since 1956, continues to hit soya and corn crops and further erode inventories while the Black Sea region and a lack of rain in South America is also hitting crop yields.
Over the last four years the volatility in corn prices is shown in the chart below, and this volatility remains largely driven by supply and demand, though deliberate weakening of the US dollar by central banks certainly doesnít help.
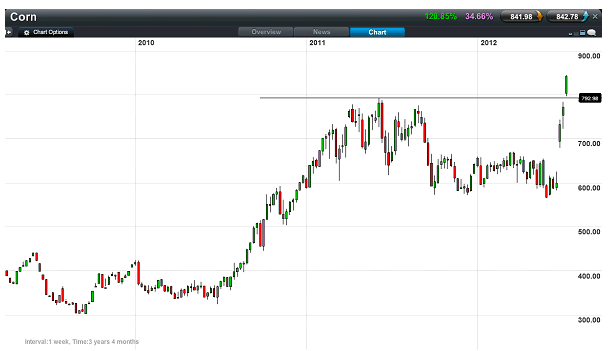 Corn Candlestick Chart
According to the latest USDA report in July it showed US corn yields at their lowest levels since 1988.
Rice Futures
The only food staple so far insulated from this sharp rise in food prices is rice, a big staple in both poor and rich regions of Asia.
Rice prices have been relatively stable in the last two to three years e.g. see the rice chart below. However if bad weather affects the price of rice then food problems in the world could get even worse.
If we are facing a food crisis, it is worth considering the additional ramifications, humanitarian as well as in global markets, if rice is impacted.
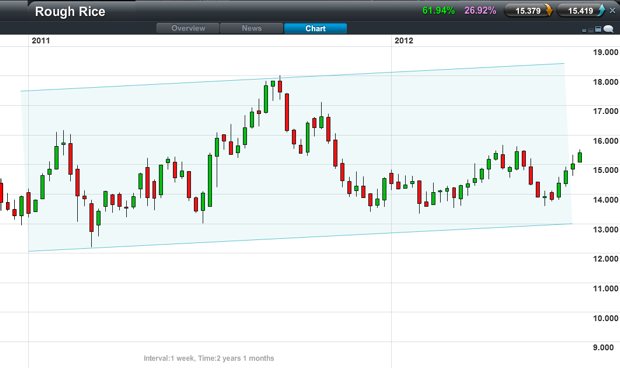 Rice Candlestick Chart
Wheat Futures
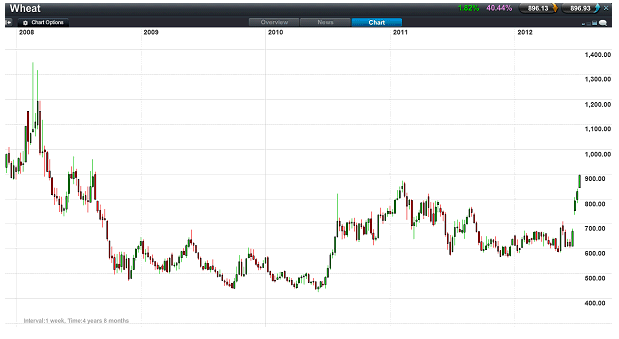
To illustrate the volatility in grain prices, a quick look at the wheat chart below gives plenty of food for thought.
In 2008, prices hit record highs of $13.50 a bushel before dropping sharply back to $4.25 a bushel at the beginning of 2010.
Within twelve months we saw the price more than double and it was this doubling in price to levels nearly $9 a bushel that prompted the Arab Spring in early 2011, before prices began to slip back again bottoming out in mid-2011 around $5.80.
 Wheat Candlestick Chart
Since then, prices have moved above their 2011 highs, once again raising fears of further unrest in countries where food prices make up a much larger proportion of the everyday spend of ordinary people.
In countries in the Middle East, food can make up 80% of a personís everyday budget.
Soft Commodities Outlook
With governments in Europe and the US looking to balance their budgets with spending cuts and households finding their budgets being eroded by inflation, any move higher in fuel and food costs is likely to be magnified by any price move higher.
This may be less of a problem in more developed economies where food price rises are more of an irritant, however, in the more indebted peripheral countries like Greece that could well change, and prompt more social unrest.
Global governments will have to confront huge social challenges as demographics change in emerging markets and demand for fuel and food continues to increase.
How they deal with these challenges will determine how volatile food prices become over the coming years and how quickly these prices continue to rise, which they surely will, if global weather continues to be as unpredictable as it has been in 2012.
'Commodities Futures' edited by Jenna Cutly, updated 22-Feb-17
For related articles also see:
Commodities Futures, updated 22-Feb-17
Commodities futures guide has daily market analysis, live prices & charts. We also have a Commodities futures price comparison and review where to trade commission-free and tax-free*. There are ... » read guide.
About this page:
Commodities Futures
Commodities futures guide has daily market analysis, live prices & charts. We also have a Commodities futures price comparison and review where to trade commission-free and tax-free*. There are ... » read from top.
|

|
Q) Average Trading Results?
A) Get free trading tips, offers, price updates, important news and more!
|
|