The CleanFinancial.com guide to gold spread betting.
- Live Gold Charts
- Live Gold Prices
- Gold Price Comparison
- Where Can I Spread Bet on Gold?
- Where Can I Trade Gold for Free?
- Where Can I Practice Trading Gold?
- Gold Commitments of Traders Report (COT)
- How to Spread Bet on the Gold Daily Market?
- How to Spread Bet on the Gold Futures Market?
- About Gold » Gold vs Supply and Demand » Hedging with Gold » Gold Prices vs FX
- Commodities Spread Betting Guide
- Case Study: Applying Fundamental and Technical Analysis to Gold
- Case Study: Applying Technical Analysis to Gold
Live Gold Chart & Prices
The CFD trading chart and prices below will give readers a helpful guide to the silver market.Gold Spread Comparison
A gold spread/price comparison table looking at the ‘spread size’ and minimum stakes for daily and futures markets.Typical In-Hours Spread Sizes |
 |
 |
 |
 |
| Gold Daily | 4 | 3 | 4 | 4 |
| Gold Future | 4† | 6 | 6 | 5 |
| Commodities – Minimum Stake | £1 | £1 | £0.5 | £1 |
Gold Market Analysis & News
5 May 2018, 12:56pm, Updated Gold COT Report
The latest Commitments of Traders Report (COT) for Gold has been released by the CFTC, see our Gold COT report below.
We have also updated our Commodities COT Summary Report.
The latest Commitments of Traders Report (COT) for Gold has been released by the CFTC, see our Gold COT report below.
We have also updated our Commodities COT Summary Report.
5 May 2018, 8:17pm, Updated Gold COT Report
The latest Commitments of Traders Report (COT) for Gold has been released by the CFTC, see our Gold COT report below.
We have also updated our Commodities COT Summary Report.
The latest Commitments of Traders Report (COT) for Gold has been released by the CFTC, see our Gold COT report below.
We have also updated our Commodities COT Summary Report.
5 May 2018, 1:06pm, Updated Gold COT Report
The latest Commitments of Traders Report (COT) for Gold has been released by the CFTC, see our Gold COT report below.
We have also updated our Commodities COT Summary Report.
The latest Commitments of Traders Report (COT) for Gold has been released by the CFTC, see our Gold COT report below.
We have also updated our Commodities COT Summary Report.
This content is for information purposes only and is not intended as a recommendation to trade. Nothing on this website should be construed as investment advice.
Unless stated otherwise, the above time is based on when we receive the data (London time). All reasonable efforts have been made to present accurate information. The above is not meant to form an exhaustive guide. Neither CleanFinancial.com nor any contributing company/author accept any responsibility for any use that may be made of the above or for the correctness or accuracy of the information provided.
Unless stated otherwise, the above time is based on when we receive the data (London time). All reasonable efforts have been made to present accurate information. The above is not meant to form an exhaustive guide. Neither CleanFinancial.com nor any contributing company/author accept any responsibility for any use that may be made of the above or for the correctness or accuracy of the information provided.
Advert:
Gold Spread Betting Guide, sponsored by FinancialSpreads.com.
You can spread bet on Gold with Financial Spreads.
You can spread bet on Gold with Financial Spreads.
Where Can I Spread Bet on Gold?
You can spread bet on gold with the following:You can also trade gold with other brokers.
Getting Spread Betting Prices and Charts for Gold
We do show reasonably accurate spread betting prices for the daily gold market further up this page, please see gold prices.The above CFD chart and prices also give a useful guide to the gold market.
If you want live gold spread betting prices and charts, you will generally need a spread betting account.
Spreads accounts with Financial Spreads, ETX and CMC give you access to both the daily and futures markets (accounts are subject to status, suitability and credit checks).
If you apply for an account and your application is approved, you can log on to review the live trading prices and charts. Usually, these are free. Having said that, you’re likely to receive the odd dull email or boring sales call from the spread betting firm.
Of course, if you decide to trade then, before you start, you should be aware that contracts for difference and spread trading do involve a high degree of risk to your funds and you can incur losses that exceed your initial deposit.
Professional Level Charts for Gold
Even though charts differ across the various providers, to help you with your trading analysis, the charts generally come with useful features and tools, including:- A number of different time intervals such as 1 minute, 2 minutes, 10 minutes, 1 hour, 1 day, 1 week etc.
- A variety of displays such as line and candle charts
- Drawing options such as Trendlines, Fibonacci Arcs, Fans and Time Zones
- Technical indicators and chart overlays such as MACD, Bollinger Bands, RSI, TSI, % Price Oscillator etc.
- BackTesting and Analysis tools
- Automated alerts when the markets reach a specific level
The financial spread betting companies below provide users with real time prices and charts:
- City Index (read review)
- ETX Capital (read review)
- Financial Spreads (read review)
- Finspreads (read review)
- IG (read review)
- Inter Trader (read review)
- Spreadex (read review)
Advert:
Gold Spread Betting Guide, sponsored by FinancialSpreads.com.
You can spread bet on Gold with Financial Spreads.
You can spread bet on Gold with Financial Spreads.
Where Can I Trade Gold for Free?
Investing, by its very nature, comes with risks. However, if you’d like to use a Test Account, which lets you access charts and practice financial spread betting, see Free Demo Account below.Also, remember that in the UK, spread betting is currently tax free*, i.e. there is no income tax, capital gains tax or stamp duty.
If you want a free commodities trading platform, note that investors can spread bet on gold without paying any commissions or brokers’ fees with firms such as:
Free Demo Account
If you’d like to open a free Practice Account where you can get a better understanding of financial spread betting, and markets like gold, then have a look at:These companies currently offer a Demo Account which investors can use to test new theories, check charts and practice using trading orders.

How to Spread Bet on the Daily Gold Market
As with a lot of markets, investors can spread bet on commodities, such as gold, to go up or down.Some spread betting companies offer a daily gold market as well as a futures market.
If we look at Financial Spreads, we can see they are currently showing the ‘Gold Rolling Daily’ market at $1,771.6 – $1,772.0.
This means an investor could spread bet on gold:
 Going above $1,772.0, or
 Going below $1,771.6
When spread betting on gold you trade in £x per $0.1. So, if you invested £3 per $0.1 and gold moves $3.8 then that would alter your P&L by £114. £3 per $0.1 x $3.8 = £114.
Rolling Daily Commodities Markets
Note that this is a Rolling Daily Market. As a result, in contrast with commodities futures markets, there is no expiry date. If you leave your trade open at the end of the day, it will roll over into the next trading session.If your position is rolled over and you are financial spread betting on the market to:
 Go up – then you will be charged a small overnight financing fee, or
 Go down – then a small payment is normally credited to your trading account
For a fully worked example see Rolling Daily Spread Betting.
Gold Rolling Daily Example
Taking the spread of $1,771.6 – $1,772.0, let’s assume that:- You’ve completed your analysis of the commodities markets, and
- You feel that the gold market will push higher than $1,772.0
With this trade you therefore make a profit of £3 for every $0.1 that gold increases higher than $1,772.0. Having said that, this trade also means that you will make a loss of £3 for every $0.1 that the gold market decreases below $1,772.0.
Put in other words, if you ‘Buy’ a spread bet then your P&L is worked out by taking the difference between the closing price of the market and the initial price you bought the spread at. You then multiply that difference in price by the stake.
Therefore, if after a few hours the market rose, you may decide to close your spread bet in order to take your profit.
Taking this a step further, if the market moved up to $1,776.1 – $1,776.5 then, to close your trade, you would sell at $1,776.1.
So, with the same £3 stake your profit would work out as:
Profit / loss = (Final Price – Initial Price) x stake
Profit / loss = ($1,776.1 – $1,772.0) x £3 per $0.1
Profit / loss = $4.1 x £3 per $0.1
Profit / loss = £123 profit
Speculating on commodities, by spread trading or otherwise, is never easy. In this case, you had bet that the metal would increase. Naturally, the commodity could decrease.
Should the gold market fall, you may choose to close your spread bet and limit your losses.
If the spread pulled back to $1,768.5 – $1,768.9 then you could close your position by selling at $1,768.5. If so, your loss would be calculated as:
Profit / loss = (Final Price – Initial Price) x stake
Profit / loss = ($1,768.5 – $1,772.0) x £3 per $0.1
Profit / loss = -$3.5 x £3 per $0.1
Profit / loss = -£105 loss
Note – gold Rolling Daily spread betting market taken as of 18-Sep-12.
Advert:
Gold Spread Betting Guide, sponsored by FinancialSpreads.com.
You can spread bet on Gold with Financial Spreads.
You can spread bet on Gold with Financial Spreads.
How to Spread Bet on Gold Futures

If you log on to Capital Spreads, you can see that they are valuing the Gold December Futures market at $1,773.7 – $1,774.3. As a result, an investor can spread bet on gold to:
 Close higher than $1,774.3, or
 Close lower than $1,773.7
On the closing date for this ‘December’ market, 27-Nov-12.
Like the Rolling Daily market, when putting a spread bet on Gold Futures you trade in £x per $0.1. Therefore, if you decided to have a stake of £5 per $0.1 and gold moves $2.0 then that would alter your profit/loss by £100. £5 per $0.1 x $2.0 = £100.
Gold Futures Example
Now, if you think about the spread of $1,773.7 – $1,774.3 and make the assumptions that:- You have analysed the commodities markets, and
- Your analysis leads you to feel that the gold market will finish above $1,774.3 by 27-Nov-12
Therefore, you win £2 for every $0.1 that gold rises higher than $1,774.3. Having said that, it also means that you will make a loss of £2 for every $0.1 that the gold market moves lower than $1,774.3.
Put another way, if you were to ‘Buy’ a spread bet then your profit/loss is worked out by taking the difference between the final price of the market and the price you bought the spread at. You then multiply that difference in price by the stake.
As a result, if, on the expiry date, gold closed at $1,781.4, then:
P&L = (Closing Value – Opening Value) x stake
P&L = ($1,781.4 – $1,774.3) x £2 per $0.1
P&L = $7.1 x £2 per $0.1
P&L = £142 profit
Speculating on commodity markets can work against you. With the above, you had bet that the gold futures market would rise. However, the futures market could fall.
If gold had fallen, closing lower at $1,768.1, you would end up losing this trade.
P&L = (Closing Value – Opening Value) x stake
P&L = ($1,768.1 – $1,774.3) x £2 per $0.1
P&L = -$6.2 x £2 per $0.1
P&L = -£124 loss
Note: Gold December Futures market quoted as of 18-Sep-12.
Advert:
Gold Spread Betting Guide, sponsored by FinancialSpreads.com.
You can spread bet on Gold with Financial Spreads.
You can spread bet on Gold with Financial Spreads.
Gold Commitments of Traders Report – 15 May 2018 (i)
Futures Only Positions, CMX , Code 88691, (Contracts of 100 troy ounces) (i)| Reporting Firms (i) | Non-Reportable Positions (i) | ||||||||
| Non-Commercial (i) |
Commercial (i) | Total Reportable (i) | |||||||
| Commitments (i) | Open (i) Interest | Commitments | |||||||
| Long (i) | Short (i) | Spreads (i) | Long | Short | Long | Short | Long | Short | |
| 201,468 | 109,025 | 65,319 | 195,925 | 314,014 | 462,712 | 488,358 | 519,958 | 57,246 | 31,600 |
| Changes from 8 May 2018 (i) | Change in (i) Open Interest | Changes from | |||||||
| Long | Short | Spreads | Long | Short | Long | Short | Long | Short | |
| 2,920 | 17,917 | 7,706 | 14,339 | -2,556 | 24,965 | 23,067 | 28,560 | 3,595 | 5,493 |
| Percent of Open Interest for Each Category of Trader (i) | |||||||||
| Long | Short | Spreads | Long | Short | Long | Short | Long | Short | |
| 38.7% | 21.0% | 12.6% | 37.7% | 60.4% | 89.0% | 93.9% | 11.0% | 6.1% | |
| Number of Traders in Each Category (i) | Total (i) Traders | ||||||||
| Long | Short | Spreads | Long | Short | Long | Short | |||
| 193 | 84 | 83 | 54 | 52 | 288 | 189 | 356 | ||
| Long/Short Commitments Ratios (i) | Long/Short Ratio | ||||||||
| Ratio | Ratio | Ratio | Ratio | ||||||
| 1.8:1 | 1:1.6 | 1:1.1 | 1.8:1 | ||||||
| Net Commitment Change (i) | |||||||||
| -14,997 | |||||||||
Also see:
- Gold Commitments of Traders chart
- Commodities COT (Commitments of Traders) Reports
- Commitments of Traders Guide
Gold COT Report Case Study
The following is just a case study and the personal view of one of our editors. Like all views on this site, it is not investment advice, 13 Dec 2013.Gold Traders Changing Positions?
The new gold COT report is out for the week to 10 December and it shows that there are ‘680 fewer contracts going long’ of gold. It also shows that there were ‘4,369 fewer contracts going short of gold’.
Therefore the ‘Net Non-Commercial Commitments’ went up by 3,689.
i.e. the big traders are slightly more bullish of gold (on a net basis). And that breaks the trend that had been in place since the report for the week ending 29 Oct:
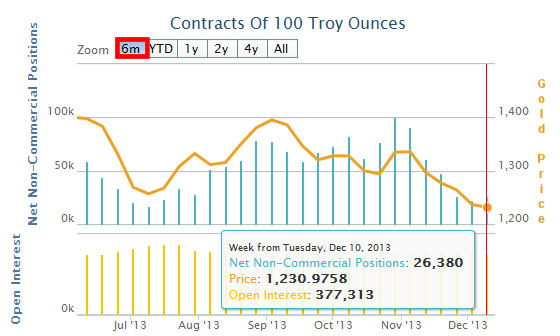
Gold Net Non-Commercial Commitments Chart, 6 Months
Can you trade on this? Maybe, maybe not. But what the big speculators are doing should probably be part of your analysis.
Yes, gold is a commodity, but it’s not just about supply and demand, the speculators play their part too.
The correlation between gold prices and the ‘Net Non-Commercial Commitments’ is far from perfect, nothing in the futures markets is ever that easy.
Having said that, the 2 year chart below makes a strong, but not perfect, argument for following the ‘Net Non-Commercial Commitments’ positions:
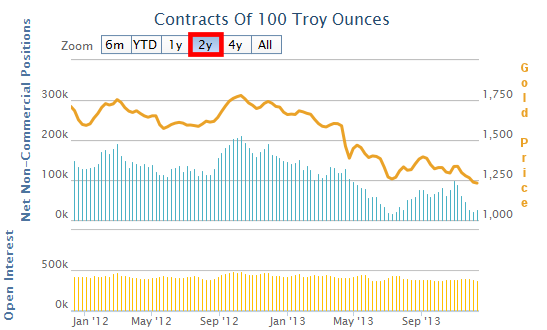
Gold Net Non-Commercial Commitments Chart, 2012-2013
At first glance, the 4 year chart below brings us down to earth.
The Jan 2010 to mid-2011 period of the chart isn’t as clear as the mid-2011 to Dec 2013 period.
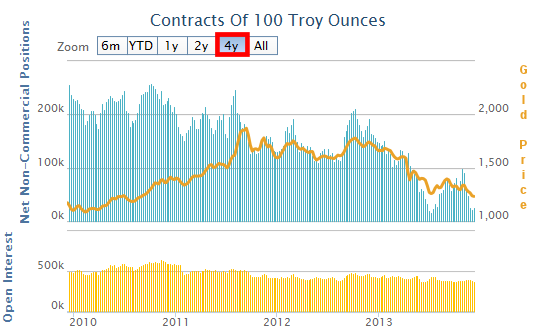
However, if you study the chart a little more, you can certainly see some correlations.
If you followed the Net Non-Commercial Commitments, you would probably lose money on some trades but that it normal with trading.
You shouldn’t aim to make a profit on every trade. You should aim to make an overall profit.
My own personal view (and not certainly not investment advice) is that with some careful trading of the gold COT reports, you may have been able to catch the general price trends.
It is unlikely that you would have gotten in, or out, of trends at the top or bottom of the market, but the trends last for long enough to make a profit.
Of course, this is just a slightly different form of technical analysis. And, the fundamental problem with technical analysis is that you are trying to predict the future using past market behaviour.
As we all know, trends change over time. Just look at Blackberry, Myspace, flared trousers and mullets.
COT Trading Risk
There are a number of risks with following the COT reports, such as the data being on a 3+ day delay.
A key risk with following a Net Non-Commercial Commitments strategy is that the market spikes and goes through your stop order. Therefore, even though your strategy might be sound, your trade gets closed.
To prevent that from happening you can:
- Trade naked (i.e. without stop orders) and that is something I would never do
- Use very wide stop orders. This is only an option for people with deep pockets and, even then, it’s not necessarily advisable
So, after that slight detour, what does this week’s report mean?
This may be a change of direction for the market, or it may just be a pause in the current trend.
I will be closely reviewing the next report to see whether it looks like a reversal or not.
More on COT Reports
- We have a COT chart here for the major metals and forex markets
- For more on understanding COT reports, see our COT guide
Getting the Latest COT Reports
We publish the new COT reports every week and cover more than 35 major markets.Readers can get most of the same data on the CTFC.gov website, however, we aim to present the data in a more readable and user friendly format.
We also do a few extra computations, like the ratios, so you don’t have to.
If you would like to be reminded of when the new COT reports are listed on www.cleanfinancial.com, simply follow us on Twitter, @spread_bettor.

About the Gold Market
Below, ‘About the Gold Market’ by PaddyPowerTrader.- Gold Prices vs Supply and Demand
Gold is one of the oldest commodities traded by man and one of the world’s biggest markets and there is as much gold as there has ever been.
One of the unusual things about gold as a commodity is that it isn’t consumed. Most other commodities end up being used as a power source, used to create plastics or foodstuffs. Gold however, is turned into jewellery or used for various industrial reasons. It doesn’t disappear, it simply exists in a different format.
In broad terms, there is the same amount of gold in the world as there ever has been. Given that all of the world’s gold still exists, it could theoretically come back onto the market at any time.
- Supply Rarely Affects the Price of Gold
The price of many commodities is largely determined by their supply. If Brazil’s coffee harvest fails, it’s likely that the price of coffee will rise. There is a stable demand for coffee but the supply is far less stable.
Wars and civil unrest in oil producing countries can threaten the supply of crude and, when these threats materialise, they typically push the price per barrel higher.
Gold however, is different. It is thought that the annual supply of gold comfortably meets the demand. And, as we have discussed, existing gold can come back to the market at any time.
Therefore, it’s not the supply of the commodity itself that leads to large price movements, but the changes in demand for gold as an investment.
There are exceptions to this though, e.g. in 2008, South Africa experienced large scale power generation/distribution problems. When these occurred, extraction levels in the country’s gold mines fell and we saw price spikes.
- Gold Prices Driven by Market Sentiment
The true value of gold doesn’t necessarily increase or decrease which makes it very different from most other traded commodities.
The price of gold is mainly influenced by the desire to own gold, i.e. market sentiment, not by the annual production. Gold tends to be a ‘safe-haven’ asset when other investments are deemed too volatile or too risky. Investors often turn to gold:
- When they lose faith in the stock market
- After a natural disaster
- During war or civil unrest
- When they lose faith in their currency
-
Using Gold as a Hedge
If stock market returns, or the return on bonds or bank deposits are low, investors will often turn to gold. It is perceived to be a stable, reliable asset which always maintains some value.
So, when interest rates are low and stock markets are in the doldrums, investors will often buy gold. And, of course, the increased demand to own gold means that the price of the commodity will generally increase.
Whilst gold is seen as a safe-haven during difficult economic periods, its price can still fluctuate significantly on a daily basis.
- Gold Prices are Influenced by Large Central Banks
At the end of 2004, central banks and official organisations held 19% of all above-ground gold in the form of official gold reserves.
Gold prices are influenced by sales and acquisitions of gold by the International Monetary Fund and by large central banks.
To try and keep gold prices more stable, an agreement was made in September 1999 which limited gold sales by major economies (in Europe, America, Australia, Japan and the IMF). This was designed to prevent a country selling large quantities of its gold reserves, leading to a fall in gold prices which would affect all nations’ reserves.
Conversely, when countries begin to increase their gold reserves, gold prices will generally rise. In recent years, both China and Russia have expressed an interest in increasing their gold reserves and, for example, gold prices increased significantly when India purchased 200 metric tons of gold in 2009.
Gold Prices and the Forex Market
Foreign exchange rates can have a big impact on commodities.Most commodities, including the key metals, energies and softs are priced in US dollars. Therefore, you can often see large price movements just because the US dollar has gained on the pound or vice versa.
With spread betting, you typically trade in the currency of your choice. If you’re based in the UK and want to trade the Dow Jones, you can do so in Pound Sterling/point. If you want to speculate on gold you would do so in Pound Sterling/$0.1 (see gold trading example).
Because gold is priced in US dollars, if the price of the dollar falls against the other major currencies then, all things being equal, we can expect the price of gold to rise. And likewise, when the dollar gets stronger, we can expect the price of gold to fall.
China and the Gold Market
In 2011 China overtook India as the largest purchaser of gold according to the World Gold Council (WGC).China now accounts for 25% of gold investment demand, compared to India which accounts for 23%. Possible reasons for this include:
- Golden Culture – In China, the giving of gold plays a significant part of the culture. Gold has been associated with Emperor status and good luck since ancient times. New Year celebrations, weddings and birthdays are all still occasions where gold is typically given or exchanged.
- Middle Class Wealth – The WGC report suggests that the increase in the disposable income amongst the Chinese middle class has also played a part in the demand increase.
- Inflation Hedge – With persistent levels of high inflation in China, local investors may view gold as an effective hedging tool.
Precious Metals Influences: The Rise of Gold 2003-2008
Below, a useful analytical view of why gold prices may rise (or fall), Anthony Grech, Market Strategist, IG Index.Between 2003 and 2008 the price of precious metals has more than doubled. That surge has been attributed to a combination of the following:
- Depreciation of the US dollar – The World Gold Council provides evidence supporting the view of an inverse relationship between the price of gold and the US dollar. Over the past five years, from 28 February 2003 to 29 February 2008, the US Dollar Index fell 26.1% while the price of precious metals soared.
- Inflation. Rising oil prices increase inflationary pressuresv – During periods of rising inflation, the price of precious metals trends upward. Studies conducted by the World Gold Council support the view that gold is a long-term hedge against inflation.
- An increase in global wealth – The rise in global income, particularly from emerging market economies such as China and India, has contributed to increased demand for precious metals for manufacturing and jewellery.
- Exchange Traded Funds (ETFs) – The introduction of ETFs stimulated demand for precious metals. ETFs initially began as a bundle of equities tracking the performance of indices and were traded on a stock exchange in the form of shares.
By 2004, ETFs moved into the precious metal sector and by early 2007 nearly 22 million ounces of gold were held in ETF accounts. By 2006, 18% of the world’s investment demand for physical gold came through ETFs. - Geopolitical tensions and uncertainty – Global political tensions generally trigger a short-term speculative rise in the value of precious metals.
A good example is the 1979 Iranian Revolution. In the run up to the crisis, the price of gold rallied from $226 in December 1978 to $512 in December 1979, a 126.5% rise in one year. During the same period, silver surged 267.6%, from $5.93 to $21.79. The recent uncertainty generated from the credit crunch and the deterioration in the housing market has instilled fear and contributed to a similar surge.
Platinum and palladium outperformed the precious metals sector over the past year. During this period, platinum and palladium surged 72.6% and 60.9%, respectively while gold rose 45.5%.
A five year view, from February 2003 to 29 February 2008, reveals that silver was by far the best performing precious metal, up 330.8%. Platinum placed second with a 215.7% rise, followed by gold’s 178.4% increase.
Case Study 1: Applying Fundamental and Technical Analysis to Gold
Below, an older but still useful gold case study by Shai Heffetz, InterTrader, 5-Apr-2011.Gold Fundamental Analysis
The long-term outlook for gold looks bullish. The continued uncertainty in the MENA region, as well as the downward adjustment of Greece and Portugal’s credit ratings by Standards and Poor, the disaster in Japan and continued fears of inflation in Europe will all put upwards pressure on the price of gold.Gold Technical Analysis
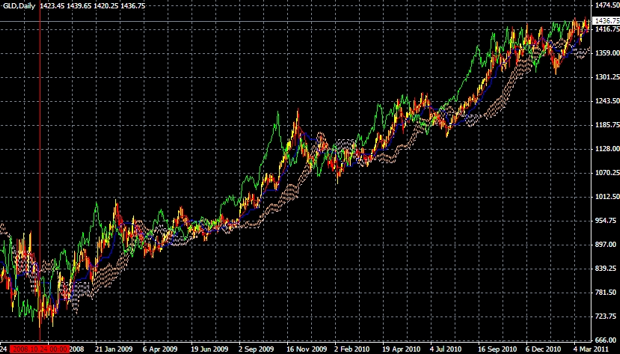
Apart from a couple of relatively minor corrections, gold has now been in a strong bull market for nearly two and a half years.Turning our attention to the medium term time frame, in the chart below we see that the gold price traded below the Ichimoku cloud for about a month between mid-January and mid-February 2011. It subsequently recovered, broke out of the cloud and reached a new high of $1447.55 on 24th March 2011. However, it retreated later that day, to close on $1432.15.
According to the Ichimoku, the bull run in the gold market is still intact. The green Chinkou Span line is well above the price and the price in turn is above the cloud. The red Tenkan Sen line is also still above the blue Kijun Sen, clearly indicating a bull run.
The fact that March did not seen much real movement in the gold price should, however, caution traders not to make hasty trading decisions. Recent prices have been at the same level as on 2nd March, indicating some uncertainty in the market.
If the price continues to rise, to reach a new high, it will be a clear sign that the bull run is still intact. A drop below the Tenkan Sen or even the Kijun Sen could indicate that a correction is on the way, in which case it is probably better to stay out of the market until clear signals emerge.
Daily Gold Spread Betting Chart
Case Study 2: Applying Technical Analysis to Gold
Another useful gold market case study Shai Heffetz, InterTrader, 24-Aug-2011.If you have been buying gold during the past few months, you could have made profits that are nearly unheard of for stock markets under current conditions.
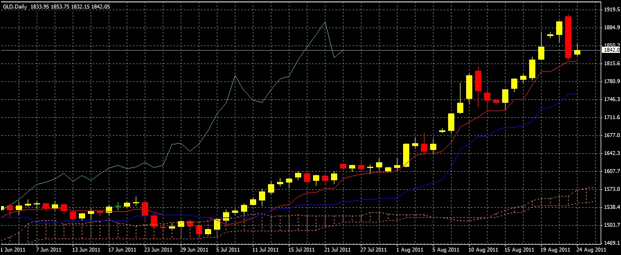
If we look at the chart below we see that, after a period of sideways trading, the gold market emerged from the Ichimoku Kinko Hyo cloud on 6 July and closed at $1528.75.
After that, it was a bull run all the way, except for a few relatively minor price corrections. On 23 August, it briefly touched $1906.75 before profit taking forced it down again.
One of these corrections occurred between 11 and 14 August when we saw the price decline from $1792.85 to $1740.45 over the course of three days.
On the 23 August, we saw another, quite severe, price correction: the price opened at $1906.75 and dropped to $1823.25 during the day.
Gold Spread Betting Chart
If we look at the bigger picture, we see that the price is currently far above the Ichimoku cloud. It is also above the red Tenkan Sen and the blue Kijun Sen, indicating that even on the short term the bull run has not been broken.
The green Chinkou Span is also well above the price 26 periods ago, showing that on the medium term we are indeed seeing a bull market.
A cautious trader would wait until the price breaks through the recent high of $1906.75 again before entering a long trade. Depending on your trading strategy, if you are currently in a long trade and the market drops below the blue Kijun Sen line, it might be time to re-evaluate your situation.
Only day traders will be looking for short trades in the present market. Any drop below the red Tenkan Sen line could indicate a good entry point for a brief short trade on a day trading basis.
(Fundamental) Medium Term Outlook
The continued economic woes in much of Europe, the credit downgrading of the USA, and the political uncertainty in the MENA region all point to continued demand for gold in the short to medium term.We could see significant price corrections, but should these conditions continue, we may see the gold price moving closer to $2,000 over the next few weeks.
Case Study 3: Applying Technical Analysis to Gold
Below, another older-but-still-useful case study on gold by Shai Heffetz, InterTrader, 12-May-2011.Gold has technically been in a bull run ever since it broke free of the Ichimoku Kinko Hyo in mid-February.
There was a relatively large correction at the beginning of March, enough to send the price below the blue Kijun Sen medium term average, however, the price subsequently recovered and ended at a new high of $1562.05 on 29 April.
On 2 May it briefly touched a high of $1574.95 before starting to decline. It dropped as low as $1462.25 on 5 May before recovering somewhat. At the time of writing, the price is hovering around $1498.
If we consider the chart below, the gold technical analysis still suggests we are in a bull market. The green Chinkou Span line is still well above the price 26 periods ago and the price is also still trading above the cloud.
The fact that the price has dropped below the blue Kijun-Sen medium term average, however, shows us that a price correction could be on the way. A return above the red Tenkan-Sen line could indicate that the bull market is intact and that we can expect new highs.
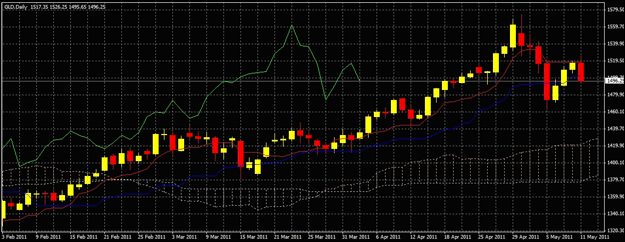
Should the price increase above the recent high of $1574.95 again, traders will have even more confidence that the bull market is intact.
Apart from day traders, who trade in shorter term movements, it’s too early for many investors to look at short trades right now. The price must first at least enter the Ichimoku Cloud, or preferably break out downwards.
The forces driving the gold market are still in place: uncertain economic times, a decline in the Dollar, political unrest in the MENA region and uncertainty over the credit worthiness of some emerging economies.
Everything else remaining the same, it is unlikely that we will soon witness a major downturn in the gold price.
Case Study 4: Technical Analysis for Gold Futures
Below, an older but interesting example of how you can apply technical analysis to the gold futures market by Shai Heffetz, InterTrader, 7-Dec-2011.In the current financial and economic turmoil, investors have often asked whether precious metals, such as gold or silver, can still act as a reliable store of value.
We will only be able to answer this question over the longer term, but if we look at the gold technical analysis there is little doubt that the yellow metal at least has remained good long-term investment.
Nevertheless, if we look at the daily gold chart below, we can see that gold seems to have run into some problems over the medium term.

The price increased significantly between 1st July and 22nd August 2011, but since then we have seen a net decline from just below $1,900 to the current level of $1,729.25. It actually dropped to $1,532.65 on 26th September before starting to recover.
On 27th October the price broke out of the Ichimoku cloud again, at which time a renewed bull run seemed quite likely. However, the yellow metal then confounded the bulls by dropping back into the cloud.
Right now, the price has recovered to close to the upper limit of the Ichimoku cloud. The green Chinkou Span line is at the same level as the price 26 periods ago and the red Tenkan Sen and the blue Kijun Sen lines are either in the cloud or touching it.
All this suggests that the metal has entered an uncertain stage and that the best thing right now is to wait.
Once the price moves above the recent high of $1,798.15 we saw on 7th November, a long trade becomes feasible. On the other hand, short traders should at least wait for a break below $1,603.25, which we saw on 20th October.
Case Study 5: Applying to Technical Analysis to Euro/Dollar & Gold
Below, another interesting example of how you can apply technical analysis to the futures market by Shai Heffetz, InterTrader, 11-Nov-2011.The turmoil we have seen on global spread betting markets during the past few months has started to cast doubt on whether any current world currency can be regarded as relatively stable.
The euro for one has not been doing very well lately and the US dollar is not much better off. This has sparked renewed interest in gold as a save haven for battle weary investors.
If we look at the daily gold chart below, we can see that the metal reached a record high of $1,921 on the 6th of September, a time when many traders thought the price was heading for $2,000.
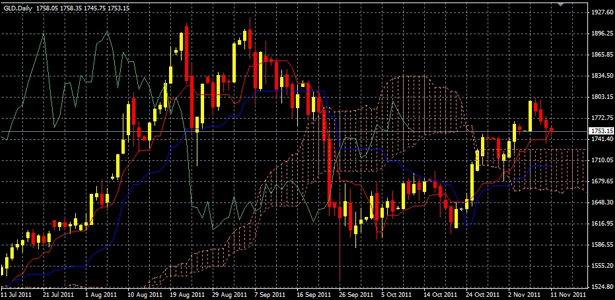
Gold Futures Chart (with Ichimoku cloud)
However, we then saw something of a collapse, compounded by large-scale profit taking, which caused the price to briefly touch a low of $1582.75 on the 29th of September 2011.
Since then, the lingering Eurozone debt crisis has failed to be completely resolved and we have seen a renewed surge in the gold futures market.
On the 25th of October, analysis showed that it broke through both the blue Kijun Sen and the Red Tenkan Sen lines and, soon afterwards, it also broke upwards out of the Ichimoku cloud.
After reaching a maximum of $1,798.15 on the 7th of November 2011, we have recently experienced a few down days, but this is probably more the result of profit taking than anything else.
Currently the price is still above the Ichimoku cloud. The red Tenkan Sen has also broken out of the Ichimoku cloud and the green Chinkou Span is well above the price of 26 periods ago; all confirming that we are currently in a bull run.
Having said that, a cautious trader would wait for the precious metal to reach a new high, above the $1,798.15 level, before entering a long trade.
Short trades are only for day traders right now, who are looking to cash in on short-term corrections like the one we have seen over the past few days.
Advert:
Gold Spread Betting Guide, sponsored by FinancialSpreads.com.
You can spread bet on Gold with Financial Spreads.
You can spread bet on Gold with Financial Spreads.
Spread betting and CFD trading carry a high level of risk to your capital and you may lose more than your initial investment. Spread betting and CFD trading may not be suitable for all investors. Only speculate with money that you can afford to lose. Please ensure you fully understand the risks involved and seek independent financial advice where necessary.


