
The CleanFinancial.com guide to Ichimoku Clouds.
- How to Analyse an Ichimoku Cloud
- Basics of the Ichimoku Cloud
- How to Select an Ichimoku Cloud
- Where to Get Charts with Ichimoku Clouds
- Analysing Ichimoku Clouds
- Applying Ichimoku Clouds to the Stock Market
- Applying Ichimoku Clouds to the Forex Market
- Applying Ichimoku Clouds to the Gold Market (Example 1)
- Applying Ichimoku Clouds to the Gold Market (Example 2)
What is the Ichimoku Cloud?
The ichimoku cloud was developed in the 1960s by Goichi Hosoda, a Japanese journalist. Some investors prefer the Ichimoku Cloud to a standard candlestick chart because it gives more data points.How to Analyse an Ichimoku Cloud
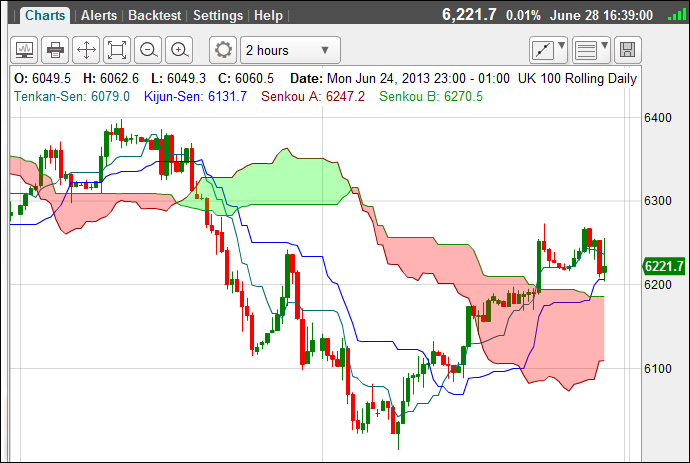
Below we show a typical Ichimoku Cloud which has been added to a FTSE 100 (UK 100) candlestick chart.- When prices are above the cloud, the market is deemed to be in an uptrend
- When prices are below the cloud, the market is deemed to be in a downtrend
- When prices are in the cloud, the market is deemed to be flat
- When the Senkou A line is rising above the Senkou B line, this creates a cloud which is normally green, and it indicates a ‘strengthened uptrend’
- When the Senkou B line is above the Senkou A line, this creates a cloud which is normally red, and it indicates a ‘strengthened downtrend’
Basics of the Ichimoku Cloud
The Tenkan-sen (Conversion Line)- Default setting: 9 periods
- The mid point of the 9 period high-low range
- Calculation = (9 period high + 9 period low)/2
- Default setting: 26 periods
- The midpoint of the 26 day high-low range
- Calculation = (26 period high + 26 period low)/2
- Default setting: 26 periods
- The midpoint between the Conversion Line and the Base Line
- The Leading Span A forms one of the two Cloud boundaries
- It is classed as ‘Leading’ because it is plotted 26 periods in the future and forms the faster Cloud boundary
- Calculation = (Conversion Line + Base Line)/2
- Default setting: 52 periods
- The midpoint of the 52 day high-low range
- This value is plotted 26 periods in the future
- It forms the slower Cloud boundary
- Calculation = (52 period high + 52 period low)/2
Where to Get Charts with Ichimoku Clouds
You can get these from a number of CFD and spread betting companies including:How to Select an Ichimoku Cloud
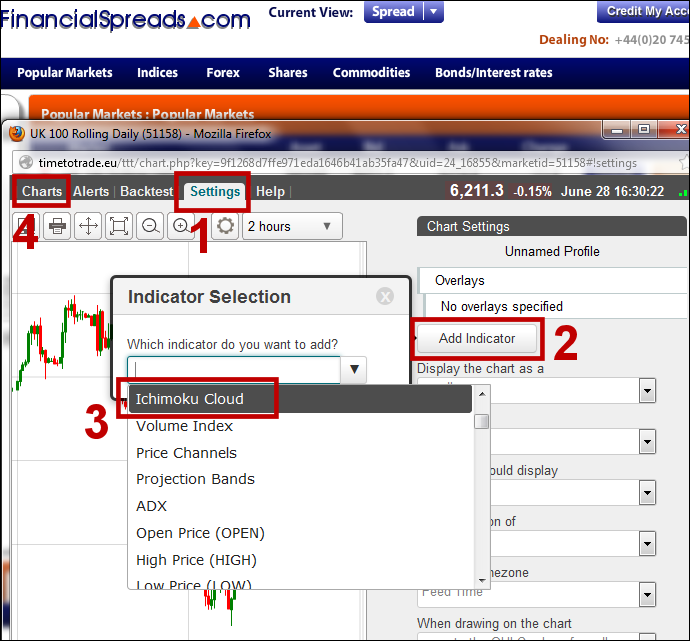
The screenshot below is based on the Financial Spreads platform, however Capital Spreads, Tradefair and InterTrader all work in the same way.To apply an Ichimoku Cloud to your chart, assuming your chart is open then:
- Click ‘Settings’
- Click ‘Add Indicator’
- Scroll down the list of indicators and click on ‘Ichimoku Cloud’
- Remove the settings menu by clicking ‘Charts’
Analysing Ichimoku Clouds
Below, we talk through a series of real life trading examples and how you might use an Ichimoku Clouds to help your technical analysis.Combining Fundamental Analysis and the Ichimoku Cloud
Case study by Shai Heffetz, InterTrader, 1-Jun-2011.Crude Oil Analysis: Fundamental Issues
The initial reaction of the markets to the unrest in some oil-producing countries of North Africa and the Middle East seems to have faded a bit now.
The crude oil market itself hit a high of $126.88 on 8 April and since then it first dropped significantly and then started to move sideways.
Summer has also arrived in the Northern Hemisphere, easing demand for oil and further alleviating pressure on the price.
Having said that, things are still volatile and any threat to supply will no doubt result in further upward pressure on the price.
The rebuilding process in Japan following the recent disaster, along with continued strong growth in China and other countries in the Far East, will keep demand strong for the foreseeable future.
Crude Oil Analysis: The Technical Picture
In the chart below, we can see that the strong bull market that reigned since the last quarter of 2010 has apparently lost momentum.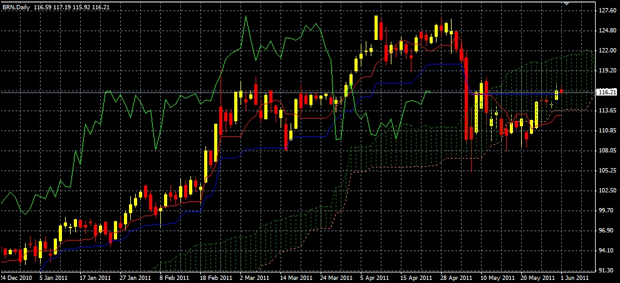
The price is currently trading within the Ichimoku cloud, which is an area of uncertainty where traders are advised to stay out of the market until clear signals emerge.
The green Chinkou Span line is below the price of 26 periods ago, further strengthening our view that the bull market has come to an end, at least for now.
The red Tenkan Sen line is also below the blue Kijun Sen, showing that at least in the short term the bears are reigning.
Going long on oil for a medium-term trade can only be recommended once the price breaks upwards out of the Ichimoku cloud again.
If the price breaks out of the cloud in a downward direction and drops below the recent brief low of $105.15, we could actually see the start of a medium-term bear market, in which case going short will be a reasonable option.
Applying Ichimoku Clouds to the Stock Market
Case study by Shai Heffetz, InterTrader, 31-Aug-2011.If we look at the first chart below, we see that the S&P 500 was in a bull run from the beginning of September 2010.
This lasted until the middle of March 2011. By that time, the price entered the cloud of the Ichimoku Kinko Hyo, which signalled the end of the bull market.
Since then it has been moving mainly sideways, with several fake breakouts from the Ichimoku cloud.
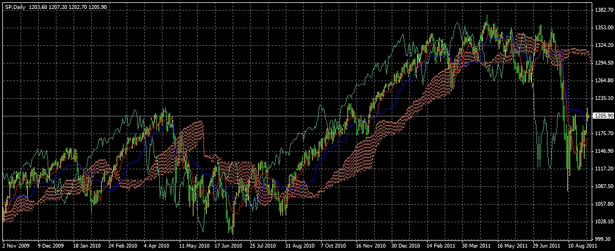
Moving to the shorter term chart below, we can see that on the 1 August there was another breakout from the Ichimoku cloud, this time downwards.
Unfortunately, the price did not turn around, as many traders had expected, but kept on dropping until it hit a brief low of 1079.90 on 9 August.
Since then it has recovered somewhat, first breaking through the red Tenkan Sen Line and later through the blue Kijun Sen.
At the time of writing, it is trading at 1206.40, after opening significantly lower than the closing price of the previous day (30 August 2011).

The sharp downturn we saw after 1 August 2011 can most likely be ascribed to the US debt crisis and the inability of politicians to reach a timely agreement about raising the debt ceiling. Once they managed to raise the ceiling, the price started recovering soon afterwards.
From a technical point of view, the S&P 500 is still in a bear phase. The price is well below the Ichimoku cloud and the green Chinkou Span line is also well below the price of 26 periods ago.
The recent recovery is still too small to warrant a long trade; this will have to wait until the price emerges upwards from the Ichimoku cloud again, which is still a long way off.
Investors will of course always find opportunities for short or long trades, since they trade in a much shorter timeframe.
Applying Ichimoku Clouds to Forex Markets (Example 1)
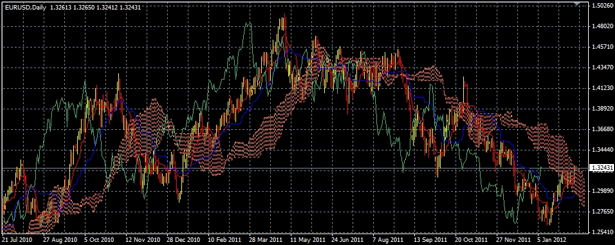
Case study by Shai Heffetz, InterTrader, 8-Feb-2011.The long term daily chart below shows that the EUR/USD exchange rate is currently at exactly the same level as it was at the beginning of August 2010.
Since then it has gone up to a high of just below $1.50 at the beginning of May last year. After that it started a slow process of decline, which was only interrupted by a few spikes above the Ichimoku cloud.
EUR/USD Analysis
The shorter term daily chart below shows that the EUR/USD market reached a low of $1.26251 on 16 January 2012.
Since then we have experienced a reasonably strong surge in the rate and as of today, 8 February, it stands at $1.32440.
Analysis of the Ichimoku chart suggests that the green Chinkou Span line is well above the price of 26 periods ago, which is suggestive of a bullish phase, at least for now.

The exchange rate is also above both the blue Kijun Sen and the Red Tenkan Sen lines, which further supports the view of a bull phase.
The price is, however, still in the Ichimoku cloud, which should caution us not to jump the gun here. Wait for at least two clear closes above the cloud before entering a long trade.
If the price should climb from there and rise above the maximum of $1.42464 we saw on 27 October last year, it might be a clear signal that the longer term bear run is finally over.
Applying Ichimoku Clouds to Forex Markets (Example 2)
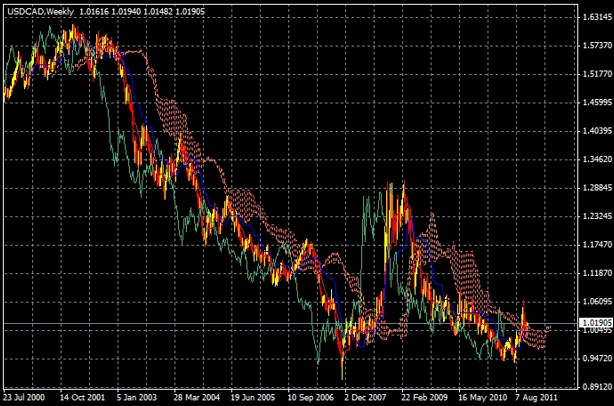
Case study by Shai Heffetz, InterTrader, 8-Nov-2011.If we study the weekly chart of the USD/CAD below, we can see that the US dollar has been in a long-term downtrend against the Canadian dollar for a number of years.
This started back in 2001, when it traded in the region of C$1.60 and lasted for nearly six years. On 4 November 2007, the USD/CAD spread betting market dropped to a low of C$0.90560.
For the biggest part of 2008 and the first part of 2009, the US dollar was trying to recover some of the lost ground and it partially succeeded.
On 8 March 2009, it reached a high of C$1.30600 before going into a new declining phase that lasted more than two years.
However, it did not quite reach the lows of 2007 again: on the 26 July 2011, it briefly touched C$0.94052 before starting to recover somewhat.
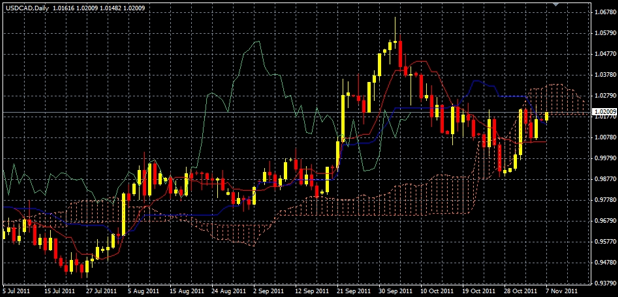
Switching to the daily chart below, we see that since then we have experienced a mini bull run.
On 4 October 2011, the pair briefly touched a high of C$1.06567.
After that, the price has been dropping steadily once more and analysis shows that it closed below the Ichimoku cloud for the first time on the 27 October 2011.
Right now, the price is slightly above the bottom Senkou Span B line of the Ichimoku cloud. It is therefore in the ‘uncertain’ part of the cloud, where traders are typically advised to adopt a wait-and-see approach.
The green Chinkou Span is still below the price of 26 periods again, indicating that we are in a bear phase. This is confirmed by the blue Kijun Sen and the red Tenkan Sen lines, which are both below the Ichimoku cloud.
For long trades, a cautious investor would wait for at least two closes above the cloud. For short trades, the price should at least break downwards through the blue Kijun Sen and the red Tenkan Sen.
Applying Ichimoku Clouds to the Gold Market (Example 1)
Case study by Shai Heffetz, InterTrader, 13-Oct-2011.On the morning of 6 September 2011 many gold investors would have woken up with a feeling of expectant excitement.
They were sure that this would be the day that gold broke through the $2,000 barrier and headed for untold heights. After all, the uncertainty that caused the latest bull run in gold was intact, with the Euro debt crisis still simmering like an evil brew.
This was not to be: the price opened at $1901.85, marginally higher than the previous day’s closing price, and briefly moved up to $1921 but then it started dropping and dropping some more.
At one point it was trading as low as $1859.85. When it finally closed at $1875.10 many of those who were long of gold heaved a sigh of relief.
The worst was yet to come and since then the commodity has done little but drop.
The chart below shows that, on 21 September, the gold price entered the Ichimoku cloud and continued dropping.
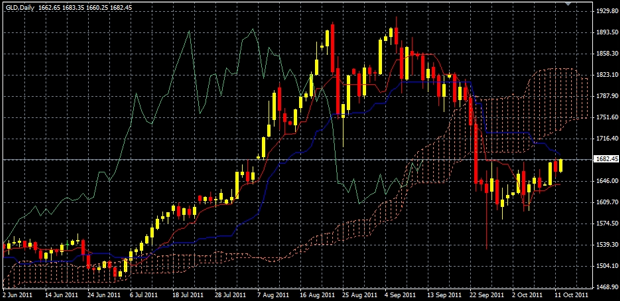
The price emerged from the bottom of the cloud on the 23 September and this was a dark day for bullish traders, during which gold lost nearly $100 on a single day.
We have seen something of a correction since, and the current price of $1686.75 is significantly higher than the recent low of $1532.65 we saw on the 26th of September.
However, gold analysis shows that it is still far below the Ichimoku Kinko Hyo cloud. The green Chinkou Span line is also still far below the price of 26 periods ago, confirming that we are still in the grips of a bear run.
The fact that the price is somewhat above the red Tenkan Sen line simply confirms that we have recently experienced an attempt by the bulls to restore the previous trend. This is not enough to prove anything.
The bull market can not be considered restored until we see a clear upwards break from the Ichimoku cloud that forms a new high.
This is very far away indeed. For now we might see a sideways movement at best. Any new low could be an indication that a renewed bear run is on the way.
Applying Ichimoku Clouds to the Gold Market (Example 2)
Case study by Shai Heffetz, InterTrader, 8-Jun-2011.At the beginning of May we saw a relatively large correction in the gold market.
On 5 May it even dropped below the blue Kijun Sen line, as shown in the chart below, and closed at $1474.05.
The bulls proved too strong, however, and after that the price started recovering. On 10 May it was back above the Kijun Sen and closed at $1517.15.
After that another minor correction followed and the price dropped below the Kijun Sen again, this time between the 11 and 23 May. On 24 May it was back above the blue Kijun Sen and closed at $1525.25.
Although it hasn’t yet reached the high of $1562.05, which it reached on 29 April, the gold market could be well on its way there.
If we consider the chart below, the price is above the Ichimoku cloud and also above the red Tenkan Sen and the blue Kijun Sen lines. In addition, the upswing is confirmed by the red Tenkan Sen line which is above the blue Kijun Sen.
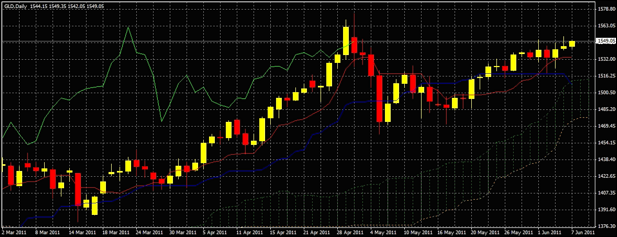
The only cautionary note is struck by the green Chinkou Span line, which is not above the price of 26 periods ago and indicates that a continuation of the bull run can not yet be fully confirmed.
Should the price break through the previous high of $1562.05, it could be seen as a clear signal that the bull run has resumed.
Any weakness in the price, below even the red Tenkan Sen line, and definitely below the blue Kijun Sen, could mean uncertainty in the market, in which case it would be better to stay out of the trade.
Under these circumstances, it is likely that short trades should only be entered into by day traders using the Ichimoku Kinko Hyo in a shorter time frame, e.g. hourly or even shorter.
Spread betting and CFD trading carry a high level of risk to your capital and you may lose more than your initial investment. Spread betting and CFD trading may not be suitable for all investors. Only speculate with money that you can afford to lose. Please ensure you fully understand the risks involved and seek independent financial advice where necessary.
