The CleanFinancial guide to GBP/USD spread betting.
- Where Can I Spread Bet on GBP/USD?
- Live GBP/USD Charts
- Live GBP/USD Prices
- GBP/USD Trading News and Analysis
- Where Can I Trade GBP/USD for Free?
- Where Can I Practice Trading GBP/USD?
- How to Spread Bet on GBP/USD?
- Forex Spread Betting Guide
- GBP Commitments of Traders Report
- GBP/USD Price Comparison
- GBP/USD Technical Analysis Case Studies
Live GBP/USD Chart & Prices
The real-time CFD trading chart and prices below will also give you a handy view of the GBP/USD market.The Plus500 chart that we use above is normally based on the underlying GBP/USD futures contract (not the spot market).
Should you want to look at live spread betting prices and charts for GBP/USD, you will probably need a financial spread betting account.
A spreads account will also give you access to the shorter-term daily prices. Please note that opening an account is subject to status.
If your application is accepted then, once logged in, you will be able to look at the up-to-the-minute trading prices and charts. These are usually provided as part of the service. The catch? You’ll probably receive the odd boring sales call and/or dull email from your spread betting provider.
Of course, if you decide to trade then, before starting, you should be aware that contracts for difference and financial spread trading do carry a significant level of risk to your capital and losses can exceed your initial deposit.
GBP/USD Comparison
A price comparison table covering GBP/USD and other popular forex markets:Typical In-Hours Spread Sizes |
 |
 |
 |
 |
| EUR / USD Daily | 0.7 | 1 | 0.7 | 0.7 |
| GBP / USD Daily | 1 | 1.5 | 0.9 | 0.9 |
| EUR / GBP Daily | 0.8 | 1.3 | 1.5 | 0.9 |
| USD / JPY Daily | 0.8 | 1 | 0.9 | 0.7 |
| Forex – Minimum Stake | £1 | £1 | £0.5 | £1 |
Where Can I Spread Bet on GBP/USD?
Investors can trade GBP/USD through an account with any of the following spread betting companies:Clean Financial readers should note that you might be able to take a position on GBP/USD through other trading platforms.
GBP/USD Market Analysis and Trading News
5 May 2018, 12:56pm, Updated Sterling COT Report
The latest Commitments of Traders Report (COT) for Sterling has been released by the CFTC, please see our Sterling COT report below.
Readers should note that we have also updated our Forex COT Summary Report.
The latest Commitments of Traders Report (COT) for Sterling has been released by the CFTC, please see our Sterling COT report below.
Readers should note that we have also updated our Forex COT Summary Report.
5 May 2018, 8:17pm, Updated Sterling COT Report
The latest Commitments of Traders Report (COT) for Sterling has been released by the CFTC, please see our Sterling COT report below.
Readers should note that we have also updated our Forex COT Summary Report.
The latest Commitments of Traders Report (COT) for Sterling has been released by the CFTC, please see our Sterling COT report below.
Readers should note that we have also updated our Forex COT Summary Report.
» More forex trading views and analysis.
This content is for information purposes only and is not intended as a recommendation to trade. Nothing on this website should be construed as investment advice.
Unless stated otherwise, the above time is based on when we receive the data (London time). All reasonable efforts have been made to present accurate information. The above is not meant to form an exhaustive guide. Neither CleanFinancial.com nor any contributing company/author accept any responsibility for any use that may be made of the above or for the correctness or accuracy of the information provided.
Unless stated otherwise, the above time is based on when we receive the data (London time). All reasonable efforts have been made to present accurate information. The above is not meant to form an exhaustive guide. Neither CleanFinancial.com nor any contributing company/author accept any responsibility for any use that may be made of the above or for the correctness or accuracy of the information provided.
Professional Charting Packages for GBP/USD
Whilst the charts can differ from platform to platform, to aid your GBP/USD analysis, they generally come with handy tools such as:- A large range of time intervals – 1 minute, 15 minutes, 2 hours and so on
- Different display options – candlestick, bar and line charts
- Drawing tools – trendlines, Fibonacci arcs, fans and time zones
- Technical indicators – Exponential Moving Average, Relative Strength Index (RSI), Standard Deviation and so on
- BackTesting functions
- Automatic alerts for when a market reaches a certain price
The following financial spread betting companies give account holders access to real time trading prices/charts:
- City Index (read review)
- ETX Capital (read review)
- Financial Spreads (read review)
- Finspreads (read review)
- IG (read review)
- Inter Trader (read review)
- Spreadex (read review)
Advert:
GBP/USD Spread Betting, sponsored by FinancialSpreads.com.
You can spread bet on GBP/USD with Financial Spreads.
You can spread bet on GBP/USD with Financial Spreads.
Where Can I Trade GBP/USD for Free?
By its very nature, forex trading is risky. Nevertheless, if you want to try an entirely free Demo Account, where you can practice your financial spread betting and look at charts, then see below for further details.Also, don’t forget that in the UK, spread betting is tax free*, i.e. there is no stamp duty, income tax or capital gains tax.
If you’re trying to find a free forex platform, keep in mind that investors can spread bet on GBP/USD with no brokers’ fees and no commissions on platforms like:
Free Demo Account
If you’re looking for a free Demo Account that lets users practice financial spread betting, and speculating on markets like the FTSE 100, USD/JPY, crude oil and GBP/USD, then take a look at:The above firms currently provide a free Practice Account that investors can use to test trading ideas, apply a range of trading orders and review professional level charts.
How to Spread Bet on GBP/USD?
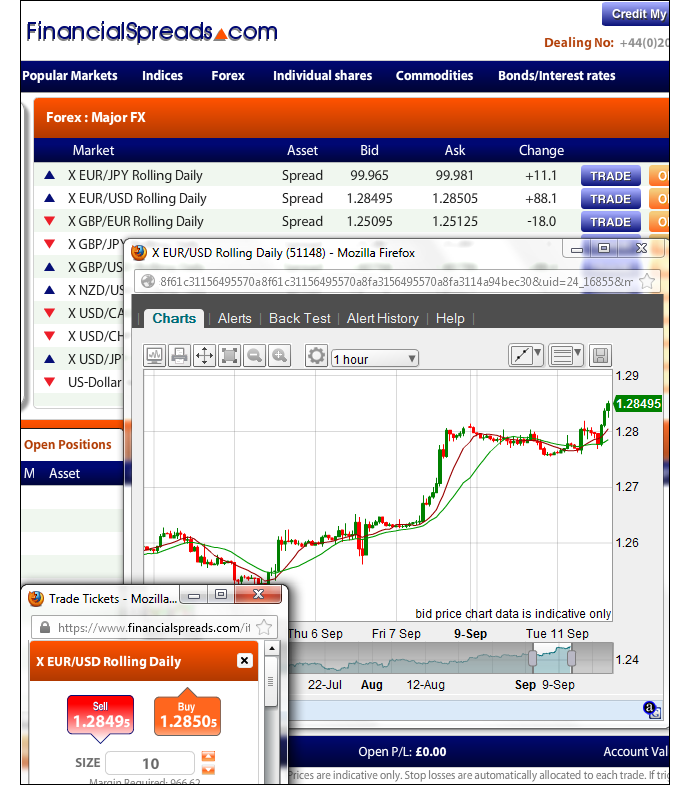
As with a wide range of markets, an investor can speculate on foreign exchange pairs, like GBP/USD, to rise or fall.If you look at Financial Spreads, you can see they are currently valuing the GBP/USD Rolling Daily market at $1.60680 – $1.60700. This means that you can put a spread bet on the GBP/USD:
 Going above $1.60700, or
 Going below $1.60680
When spread trading on GBP/USD you trade in £x per point where a point is $0.00010 of the pairs movement. Therefore, should you decide to risk £4 per point and GBP/USD moves 34.0 points then that would be a difference to your P&L of £136. £4 per point x $0.00340 = £4 per point x 34.0 points = £136.
Rolling Daily Foreign Exchange Markets
You should note that this is a Rolling Daily Market which means that unlike a futures market, there is no closing date. If your trade is open at the end of the day, it will roll over to the next trading day.If a forex spread bet is rolled over then you are normally charged a small financing fee. For a more detailed guide to Rolling Daily Markets, including look at charges and a fully worked example, please read our feature Rolling Daily Spread Betting.
GBP/USD Trading Example 1
So, if we consider the above spread of $1.60680 – $1.60700 and make the assumptions:- You have completed your market research, and
- You feel that the GBP/USD market will push higher than $1.60700
This means that you win £3 for every point ($0.00010) that the GBP/USD FX rate increases above $1.60700. Of course, you will lose £3 for every point that the GBP/USD market decreases lower than $1.60700.
Put another way, should you ‘Buy’ a spread bet then your profits (or losses) are found by taking the difference between the settlement price of the market and the initial price you bought the market at. You then multiply that price difference by the stake.
Therefore, if after a few sessions the rate started to increase then you might think about closing your trade in order to lock in your profit. So if the market rose then the spread, set by the spread trading firm, might move up to $1.61222 – $1.61242. You would settle your position by selling at $1.61222. As a result, with the same £3 stake your profit would come to:
P&L = (Final Level – Initial Level) x stake
P&L = ($1.61222 – $1.60700) x £3 per point stake
P&L = $0.00522 x £3 per point stake
P&L = 52.2 points x £3 per point stake
P&L = £156.60 profit
Foreign exchange trading, by spread betting or otherwise, is not easy. In the above example, you had bet that the forex pair would rise. Naturally, the rate can also decrease.
If the GBP/USD rate had started to fall then you might choose to close your spread bet to limit your losses.
Should the market pull back to $1.60242 – $1.60262 then you would close your position by selling at $1.60242. As a result, your loss would be:
P&L = (Final Level – Initial Level) x stake
P&L = ($1.60242 – $1.60700) x £3 per point stake
P&L = -$0.00458 x £3 per point stake
P&L = -45.8 points x £3 per point stake
P&L = -£137.40 loss
Note – GBP/USD Rolling Daily forex market quoted as of 11-Sep-12.
Advert:
GBP/USD Spread Betting, sponsored by FinancialSpreads.com.
You can spread bet on GBP/USD with Financial Spreads.
You can spread bet on GBP/USD with Financial Spreads.
How to Spread Bet on Sterling-Dollar – Example 2
Looking at a platform like Financial Spreads, we can see they are currently offering the Sterling-Dollar Rolling Daily market at $1.62545 – $1.62565. Therefore, an investor could put a spread bet on the Sterling-Dollar currency rate: Moving higher than $1.62565, or
 Moving lower than $1.62545
When spread betting on Sterling-Dollar you trade in £x per point where a point is $0.00010 of the pairs movement. Therefore, if your stake was £6 per point and Sterling-Dollar moves 21.0 points then that would be a difference to your profit/loss of £126. £6 per point x $0.00210 = £6 per point x 21.0 points = £126.
If we take the above spread of $1.62545 – $1.62565 and assume:
- You have analysed the markets, and
- You feel that the Sterling-Dollar rate will move higher than $1.62565
With this trade you make a profit of £4 for every point ($0.00010) that the Sterling-Dollar rate rises above $1.62565. However, it also means that you will lose £4 for every point that the Sterling-Dollar market drops below $1.62565.
Looked at another way, should you buy a spread bet then your P&L is found by taking the difference between the closing price of the market and the price you bought the spread at. You then multiply that price difference by the stake.
Therefore, if after a few hours the currency rate rose then you might consider closing your position in order to secure your profit.
If the underlying market moved up then the spread might change to $1.62947 – $1.62967. You would close your trade by selling at $1.62947. So, with the same £4 stake your profit would be calculated as:
P&L = (Closing Price – Initial Price) x stake
P&L = ($1.62947 – $1.62565) x £4 per point stake
P&L = $0.00382 x £4 per point stake
P&L = 38.2 points x £4 per point stake
P&L = £152.80 profit
The Pound Sterling – US Dollar market is volatile and trading it is never easy. In this example, you wanted the currency pair to rise. Of course, the FX rate might decrease.
If the Pound Sterling – US Dollar market dropped then you might decide to close your trade to cap your losses.
So if the market fell to $1.62227 – $1.62247 you would close your position by selling at $1.62227. This would result in a loss of:
P&L = (Closing Price – Initial Price) x stake
P&L = ($1.62227 – $1.62565) x £4 per point stake
P&L = -$0.00338 x £4 per point stake
P&L = -33.8 points x £4 per point stake
P&L = -£135.20 loss
Note – Sterling-Dollar Rolling Daily forex market accurate as of 18-Sep-12.
Advert:
GBP/USD Spread Betting, sponsored by FinancialSpreads.com.
You can spread bet on GBP/USD with Financial Spreads.
You can spread bet on GBP/USD with Financial Spreads.
Sterling Commitments of Traders Report – 15 May 2018 (i)
Futures Only Positions, CME , Code 96742, (Contracts of £62,500) (i)| Reporting Firms (i) | Non-Reportable Positions (i) | ||||||||
| Non-Commercial (i) |
Commercial (i) | Total Reportable (i) | |||||||
| Commitments (i) | Open (i) Interest | Commitments | |||||||
| Long (i) | Short (i) | Spreads (i) | Long | Short | Long | Short | Long | Short | |
| 61,361 | 55,740 | 7,943 | 91,070 | 96,114 | 160,374 | 159,797 | 190,648 | 30,274 | 30,851 |
| Changes from 8 May 2018 (i) | Change in (i) Open Interest | Changes from | |||||||
| Long | Short | Spreads | Long | Short | Long | Short | Long | Short | |
| -833 | 2,534 | -1,251 | 6,204 | 868 | 4,120 | 2,151 | 1,846 | -2,274 | -305 |
| Percent of Open Interest for Each Category of Trader (i) | |||||||||
| Long | Short | Spreads | Long | Short | Long | Short | Long | Short | |
| 32.2% | 29.2% | 4.2% | 47.8% | 50.4% | 84.1% | 83.8% | 15.9% | 16.2% | |
| Number of Traders in Each Category (i) | Total (i) Traders | ||||||||
| Long | Short | Spreads | Long | Short | Long | Short | |||
| 39 | 32 | 20 | 28 | 40 | 76 | 84 | 122 | ||
| Long/Short Commitments Ratios (i) | Long/Short Ratio | ||||||||
| Ratio | Ratio | Ratio | Ratio | ||||||
| 1.1:1 | 1:1.1 | 1:1 | 1:1 | ||||||
| Net Commitment Change (i) | |||||||||
| -3,367 | |||||||||
Also see:
- Sterling Commitments of Traders chart
- Forex COT (Commitments of Traders) Reports
- Commitments of Traders Guide
Applying Technical Analysis to GBP/USD
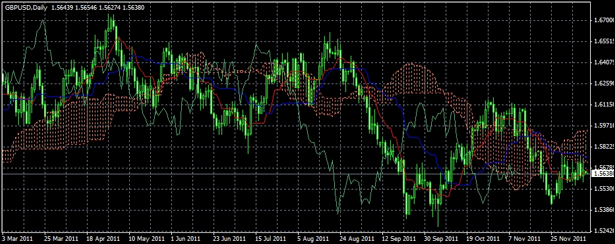
Below, an older but still useful case study on the sterling/dollar market by Shai Heffetz, InterTrader, 12-Dec-2011.The chart below shows the medium term GBP/USD market (daily chart).
Here we can see that for the six months between 1 March 2011 and 1 September 2011 the price moved in a wide band before ending up back where it started at the beginning of March, between $1.62 and $1.63.
From the start of September we saw a fairly sharp decline; on 22 September the exchange rate briefly touched a low of $1.53264. Since then, however, we have seen it recover to $1.61649 on 31st October.
What is significant is that this high was lower than the previous high of $1.67450, which we saw on 28 April 2011. Since then we have, in fact, seen the lows getting progressively lower, an indication that we might be entering a medium term bear market.
This is in line with fundamental expectations on the economic front, with the expectation of another recession in the United Kingdom looming and continuing the turmoil in the Eurozone, both of which are bound to have an effect on Sterling.

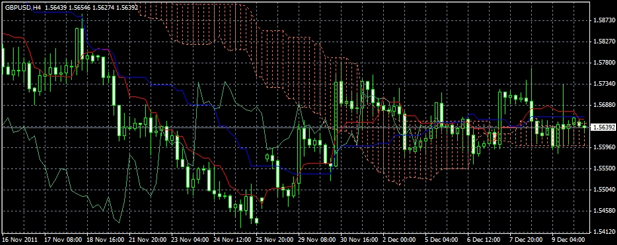
If we turn to the short term four-hourly gold chart below, we notice that after dropping to $1.54314 on 25 November, the price recovered somewhat and then started moving sideways.
Right now the technical analysis suggests that the forex pair is trading inside the Ichimoku Kinko Hyo cloud. This is the area where traders are recommended to stay on the sideline, waiting for a clear trading signal.
The green Chinkou Span line is just about equal to the price 26 period ago, which confirms that we have entered a non-trending phase. This is further confirmed by the fact that the blue Kijun Sen has turned flat.
A cautious trader would wait for the price to emerge from the cloud, in either an upward or downward direction, before entering a trade.
Given the current conditions on the forex markets, waiting for a confirmation signal, such as a new high or low might also be wise.

Spread betting and CFD trading carry a high level of risk to your capital and you may lose more than your initial investment. Spread betting and CFD trading may not be suitable for all investors. Only speculate with money that you can afford to lose. Please ensure you fully understand the risks involved and seek independent financial advice where necessary.


