The CleanFinancial guide to EUR/GBP spread betting.
- Where Can I Spread Bet on EUR/GBP?
- Live EUR/GBP Charts
- Live EUR/GBP Prices
- EUR/GBP Trading News and Analysis
- Where Can I Trade EUR/GBP for Free?
- Where Can I Practice Trading EUR/GBP?
- How to Spread Bet on EUR/GBP?
- Forex Spread Betting Guide
- EUR/GBP Technical Analysis Case Studies
Live EUR/GBP Chart & Prices
The CFD chart below will provide readers with a valuable guide to the EUR/GBP forex market.The Plus 500 chart above normally uses the EUR/GBP futures price.
If you want to analyse live spread betting charts and prices for EUR/GBP, one option is to use a spread betting account.
A spreads account would also let you access the shorter-term daily prices. Please note that opening an account is subject to suitability, status and credit checks.
Should your application be accepted then you can log on and study the live trading charts/prices. These are usually provided as part of the service. However, the catch is that you will probably get the odd sales call and/or boring email from your spread betting provider.
If you were to trade then, before starting, you should note that contracts for difference and financial spread betting involve a high level of risk and it is possible to incur losses that exceed your initial deposit.
EUR/GBP Comparison
A price comparison table covering EUR/GBP and other popular forex markets:Typical In-Hours Spread Sizes |
 |
 |
 |
 |
| EUR / USD Daily | 0.7 | 1 | 0.7 | 0.7 |
| GBP / USD Daily | 1 | 1.5 | 0.9 | 0.9 |
| EUR / GBP Daily | 0.8 | 1.3 | 1.5 | 0.9 |
| USD / JPY Daily | 0.8 | 1 | 0.9 | 0.7 |
| Forex – Minimum Stake | £1 | £1 | £0.5 | £1 |
Where Can I Spread Bet on EUR/GBP?
You can spread bet commission free on both EUR/GBP and GBP/EUR with:You may also be able to take a view on EUR/GBP and GBP/EUR on other spread betting websites.
EUR/GBP Market Analysis and Trading News
3 March 2018, 9:19am,
 The currency pair is trading above the 20-period MA of £0.87370 and above the 50-period MA of £0.87271.
1 Day Analysis
 The FX market is below the 20-DMA of £0.88491 and below the 50-DMA of £0.88337.
EUR/GBP Daily Trading News
- EUR/GBP is currently trading at £0.87465.
- At the end of the last session, the market closed £0.00033 (0.04%) higher at £0.87316.
1 Day Analysis
» More forex trading views and analysis.
This content is for information purposes only and is not intended as a recommendation to trade. Nothing on this website should be construed as investment advice.
Unless stated otherwise, the above time is based on when we receive the data (London time). All reasonable efforts have been made to present accurate information. The above is not meant to form an exhaustive guide. Neither CleanFinancial.com nor any contributing company/author accept any responsibility for any use that may be made of the above or for the correctness or accuracy of the information provided.
Unless stated otherwise, the above time is based on when we receive the data (London time). All reasonable efforts have been made to present accurate information. The above is not meant to form an exhaustive guide. Neither CleanFinancial.com nor any contributing company/author accept any responsibility for any use that may be made of the above or for the correctness or accuracy of the information provided.
Technical Charting Packages for EUR/GBP
Although the specific forex charting packages normally vary from firm to firm, in order to help your technical analysis, the majority of charts come with:- An array of intervals such as 3 minutes, 15 minutes, 2 hours etc
- Different displays such as bar charts and candle charts
- Tools for drawing features such as Trendlines, Fibonacci Arcs, Fans and Time Zones
- Indicators such as Moving Average, Relative Strength Index etc
- BackTesting tools
- Automated email alerts when the markets hit a pre-determined level
The financial spread betting brokers in the list below provide their users with live trading prices and charts:
- City Index (read review)
- ETX Capital (read review)
- Financial Spreads (read review)
- Finspreads (read review)
- IG (read review)
- Inter Trader (read review)
- Spreadex (read review)
Advert:
EUR/GBP Spread Betting, sponsored by FinancialSpreads.com.
You can spread bet on EUR/GBP with Financial Spreads.
You can spread bet on EUR/GBP with Financial Spreads.
Where Can I Trade EUR/GBP for Free?
Trading is inherently risky but if you want to open an entirely free Test Account, where you can practice spread betting, then please see below for more details.When deciding which trading option might work for you, also remember that spread trading, in the UK, is exempt from stamp duty, income tax and capital gains tax*.
If you’re looking for a free forex trading site then you should keep in mind that you can trade EUR/GBP without paying any commissions or brokers’ fees through providers like:
Free Demo Account
If you want a free Practice Account so you can try spread betting on markets like EUR/GBP, the FTSE 100 and gold, then it’s worth taking a closer look at:All of the above provide a risk free Practice Account that lets investors try out new trading theories, review charts and apply an array of trading orders, like GFD, OCO and stop loss orders.
How to Spread Bet on EUR/GBP?
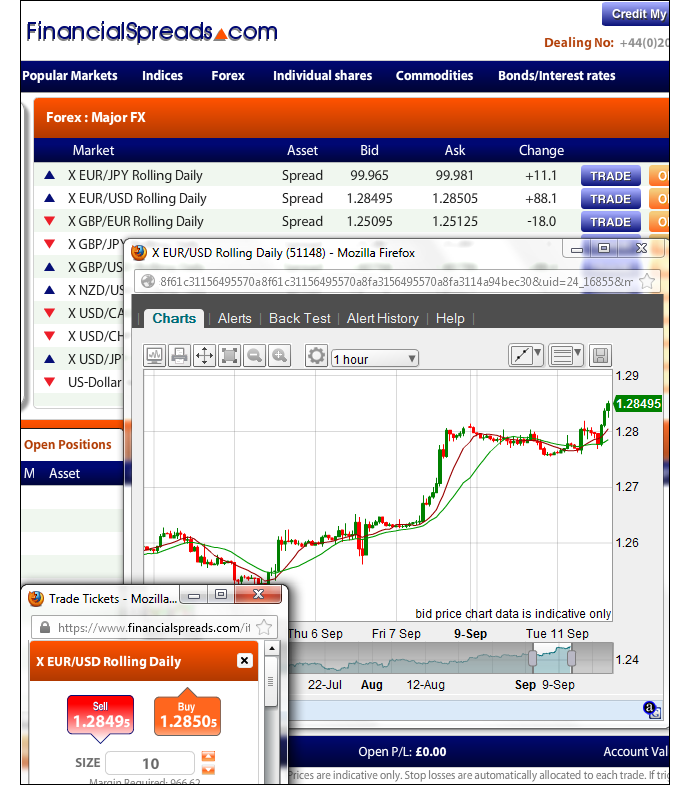
As with many global markets, you are able to speculate on forex rates, such as EUR/GBP, to either rise or fall.If we use a platform like Financial Spreads, we can see that they are currently offering the EUR/GBP Rolling Daily market at £0.80031 – £0.80041. Therefore, an investor could spread bet on the EUR/GBP pair:
 Going higher than £0.80041, or
 Going lower than £0.80031
Whilst financial spread trading on EUR/GBP you trade in £x per point where a point is £0.00010 of the pairs movement. So, should you choose to risk £3 per point and EUR/GBP moves 30.0 points then there would be a difference to your bottom line of £90. £3 per point x £0.00300 = £3 per point x 30.0 points = £90.
Rolling Daily Foreign Exchange Markets
You should note that this is a Rolling Daily Market which means that there is no closing date for this market. If a trade is still open when the markets close at the end of the day, it simply rolls over to the next session.If your forex trade does roll over then you normally pay a small overnight financing fee. For more details about overnight fees and a worked example please see Rolling Daily Spread Betting.
EUR/GBP Trading Example
If we continue with the above spread of £0.80031 – £0.80041 and assume:- You have done your forex analysis, and
- Your analysis suggests that the EUR/GBP rate will push above £0.80041
With this spread bet you gain £4 for every point (£0.00010) that the EUR/GBP pair moves higher than £0.80041. On the other hand, this trade also means you will lose £4 for every point that the EUR/GBP market moves lower than £0.80041.
Thinking of this in a slightly different way, if you buy a spread bet then your profits (or losses) are found by taking the difference between the final price of the market and the price you bought the spread at. You then multiply that price difference by your stake.
As a result, if after a few hours the EUR/GBP market rose then you might want to close your trade and therefore guarantee your profits.
If that happened then the spread might move to £0.80361 – £0.80371. To close your trade you would sell at £0.80361. So, with the same £4 stake your profit would come to:
Profit = (Closing Level – Opening Level) x stake
Profit = (£0.80361 – £0.80041) x £4 per point stake
Profit = £0.00320 x £4 per point stake
Profit = 32.0 points x £4 per point stake
Profit = £128.00 profit
Financial spread trading doesn’t always go to plan. With the above, you wanted the forex pair to rise. Of course, a currency rate can also fall.
If the EUR/GBP market had fallen then you might choose to close your trade to stop any further losses.
If the market fell to £0.79685 – £0.79695 then you would sell back your position at £0.79685. That would mean you would lose:
Loss = (Closing Level – Opening Level) x stake
Loss = (£0.79685 – £0.80041) x £4 per point stake
Loss = -£0.00356 x £4 per point stake
Loss = -35.6 points x £4 per point stake
Loss = -£142.40 loss
Note – EUR/GBP Rolling Daily FX market correct as of 11-Sep-12.
Advert:
EUR/GBP Spread Betting, sponsored by FinancialSpreads.com.
You can spread bet on EUR/GBP with Financial Spreads.
You can spread bet on EUR/GBP with Financial Spreads.

GBP/EUR Trading Example
So, if you consider the spread of €1.24385 – €1.24415 and make the assumptions that:- You have analysed the foreign exchange markets, and
- It leads you to think that the Sterling-Euro market will increase and move higher than €1.24415
With this trade, you make a profit of £2 for every point (€0.00010) that the Sterling-Euro FX rate rises above €1.24415. Conversely, however, you will lose £2 for every point that the Sterling-Euro market falls below €1.24415.
Considering this from another angle, if you were to buy a spread bet then your P&L is calculated by taking the difference between the final price of the market and the initial price you bought the market at. You then multiply that price difference by your stake.
As a result, if after a few sessions the currency rate rose then you might want to close your position so that you can lock in your profit.
If that happened then the spread, set by the spread betting company, might move up to €1.24913 – €1.24943. You would close your position by selling at €1.24913. So, with the same £2 stake this trade would make you a profit of:
Profits (or losses) = (Closing Price – Initial Price) x stake
Profits (or losses) = (€1.24913 – €1.24415) x £2 per point stake
Profits (or losses) = €0.00498 x £2 per point stake
Profits (or losses) = 49.8 points x £2 per point stake
Profits (or losses) = £99.60 profit
Speculating on forex, whether by spread betting or not, doesn’t always work out. In this example, you wanted the forex pair to rise. Nevertheless, the FX rate can also fall.
If the Sterling-Euro rate decreased then you could choose to close your position in order to restrict your losses.
So if the spread fell to €1.23980 – €1.24010 then you would settle/close your trade by selling at €1.23980. That would mean you would make a loss of:
Profits (or losses) = (Closing Price – Initial Price) x stake
Profits (or losses) = (€1.23980 – €1.24415) x £2 per point stake
Profits (or losses) = -€0.00435 x £2 per point stake
Profits (or losses) = -43.5 points x £2 per point stake
Profits (or losses) = -£87.00 loss
Note: Sterling-Euro Rolling Daily spread betting price correct as of 18-Sep-12.
Advert:
EUR/GBP Spread Betting, sponsored by FinancialSpreads.com.
You can spread bet on EUR/GBP with Financial Spreads.
You can spread bet on EUR/GBP with Financial Spreads.
Applying Technical Analysis to EUR/GBP – Case Study 1
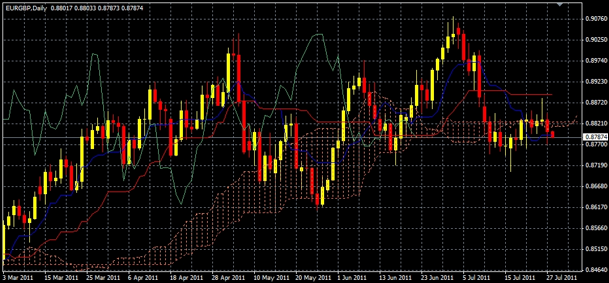
Below, an older but nevertheless useful case study on the euro/sterling market by Shai Heffetz, InterTrader, 28-Jul-2011.For the past few months there does not seem to have been a lot of momentum in the EUR/GBP market.
This is clearly illustrated by the fact that the exchange rate of these two currencies currently stands at the same level as it was at the end of March 2011.
Since then it has been channel trading with several ups and downs. Looking at the chart below we see that on 21 June the price broke out of the Ichimoku Kinko Hyo cloud in an upwards direction.

A relatively strong rally followed, which culminated in the price briefly touching £0.90821 on 1 July 2011. The next day it failed to reach a new high and subsequently closed at £0.90390.
After that, the price declined rapidly. It moved into the Ichimoku cloud and on 12 July, it broke out of the cloud in a downward direction, closing at £0.87769.
Since then, it has been rather directionless. Purely from a technical analysis point of view, it is currently still in a bear phase. The price is below the Ichimoku cloud and the green Chinkou Span line is below the price of 26 periods ago.
This means the overall sentiment is still marginally bearish. Any close below the recent minimum of £0.87039 could indicate that we will face a further decline towards £0.86095, a price touched briefly on 26 May 2011.
Going long on the EUR/GBP market right now is not advisable, unless the price increases enough to break upwards through the, rather thin, Ichimoku cloud.
Applying Technical Analysis to EUR/GBP – Case Study 2
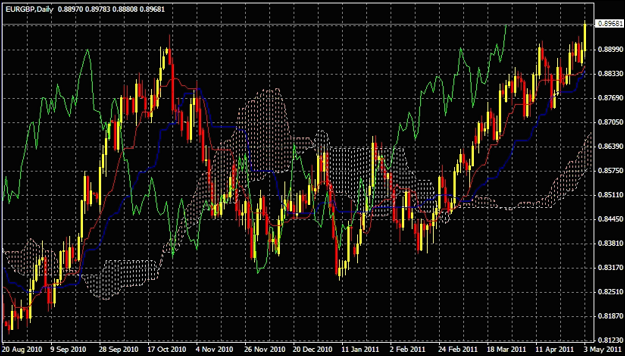
Below, another useful case study on the euro/sterling market by Shai Heffetz, InterTrader, 3-May-2011.During the past month, the Euro has continued with its bull run against Sterling which started when it first broke out of the Ichimoku cloud on 3 March.
We have seen two relatively large price corrections during this period, but neither were large enough to break the overall momentum of the bull run.
Looking at the chart below, it would seem the bull market is still intact for the FX pair.
The price of the Euro is far above the Ichimoku cloud and it is also well above both the short term (red) Tenkan-Sen line and the longer term (blue) Kijun-Sen.
Furthermore, the green Chinkou Span is also well above the price 26 periods ago, strengthening the view of an intact bull market.
Considering the longer term forex technical analysis, on 12 April the price made a failed attempt to break through the previous high it reached on the 25th of October last year near £0.89400. It subsequently retracted, but on the 3rd of May it finally broke through this psychological barrier to form a new medium term high.
The fact that the price managed to break through this resistance level means we can now look forward to new highs in the near future.
Despite this a cautious trader would wait for a price correction before entering into a long position, making use of the red Tenkan-Sen line as a stop loss or, if you have a bigger loss appetite, the blue Kijun-Sen.
Going short on the euro/sterling market is currently only feasible for day traders who can earn money through short term price fluctuations. Longer term traders should wait for the price to drop below the Ichimoku cloud before taking a short position.

Also see our guide to Ichimoku Clouds.
Spread betting and CFD trading carry a high level of risk to your capital and you may lose more than your initial investment. Spread betting and CFD trading may not be suitable for all investors. Only speculate with money that you can afford to lose. Please ensure you fully understand the risks involved and seek independent financial advice where necessary.


