The CleanFinancial.com guide to commodities spread betting.
- Commodities Price Comparison
- Live Commodities Prices
- Live Commodities Charts
- Where Can I Spread Bet on Commodities?
- Where Can I Trade Commodities for Free?
- Where Can I Practice Trading Commodities?
- Commitments of Traders Commodities Reports (COT)
- How to Spread Bet on Commodities » Gold » Crude Oil
- Individual Commodities Spread Betting Guides
- Case Study: Applying Technical Analysis to Precious Metals
- Case Study: Applying Fundamental and Technical Analysis to Energies
Live Commodities Chart & Prices
You can use the search option on the chart below to access live charts for:- Metals: gold, copper, palladium, platinum & silver
- Energies: US oil, heating oil & natural gas
- Softs: corn, cotton & soybeans
Commodities Spread Comparison
A spread/price comparison table looking at the ‘spread size’ and minimum stakes for the most popular commodities markets.Comparison Notes. This table is not meant to be inclusive, commodities spread betting may be available through other brokers.
Commodities Spread Betting Analysis & News
5 May 2018, 12:56pm, New Commodities COT Reports
The latest Commitments of Traders Report (COT) has been published by the CFTC and so we have produced a new Commodities COT Summary Report.
We have also added individual COT reports for the markets listed below. We feel our reports are easier-to-read than the CFTC version, they also have additional ratios and show the weekly net positions changes.
Note that the Commodities COT Summary Report also includes Rough Rice and Oats.
The latest Commitments of Traders Report (COT) has been published by the CFTC and so we have produced a new Commodities COT Summary Report.
We have also added individual COT reports for the markets listed below. We feel our reports are easier-to-read than the CFTC version, they also have additional ratios and show the weekly net positions changes.
| Metals COT Reports: | Energies COT Reports: | Softs COT Reports: |
Note that the Commodities COT Summary Report also includes Rough Rice and Oats.
5 May 2018, 8:17pm, New Commodities COT Reports
The latest Commitments of Traders Report (COT) has been published by the CFTC and so we have produced a new Commodities COT Summary Report.
We have also added individual COT reports for the markets listed below. We feel our reports are easier-to-read than the CFTC version, they also have additional ratios and show the weekly net positions changes.
Note that the Commodities COT Summary Report also includes Rough Rice and Oats.
The latest Commitments of Traders Report (COT) has been published by the CFTC and so we have produced a new Commodities COT Summary Report.
We have also added individual COT reports for the markets listed below. We feel our reports are easier-to-read than the CFTC version, they also have additional ratios and show the weekly net positions changes.
| Metals COT Reports: | Energies COT Reports: | Softs COT Reports: |
Note that the Commodities COT Summary Report also includes Rough Rice and Oats.
This content is for information purposes only and is not intended as a recommendation to trade. Nothing on this website should be construed as investment advice.
Unless stated otherwise, the above time is based on when we receive the data (London time). All reasonable efforts have been made to present accurate information. The above is not meant to form an exhaustive guide. Neither CleanFinancial.com nor any contributing company/author accept any responsibility for any use that may be made of the above or for the correctness or accuracy of the information provided.
Unless stated otherwise, the above time is based on when we receive the data (London time). All reasonable efforts have been made to present accurate information. The above is not meant to form an exhaustive guide. Neither CleanFinancial.com nor any contributing company/author accept any responsibility for any use that may be made of the above or for the correctness or accuracy of the information provided.
Advert:
Commodities Spread Betting Guide, sponsored by FinancialSpreads.com.
You can spread bet on Commodities with Financial Spreads.
You can spread bet on Commodities with Financial Spreads.
Where Can I Spread Bet on Commodities?

Clean Financial readers should note that you may be able to trade commodities with other brokers.
Professional Level Commodities Charts
Whilst the specific charting packages differ across the various firms, in order to help your commodities analysis, they usually have valuable features such as:- A host of different time intervals – 1 minute, 5 minutes, 1 hour, 1 day, 1 week and so on
- Different displays – line charts and candlestick charts
- Tools for adding features – Fibonacci retracements and trendlines
- Chart overlays and technical indicators – Exponential Moving Average, Bollinger Bands, Momentum, RSI, TSI, Chaikin’s Volatility and so on
- Back Testing functions
- Customised email alerts that trigger when the markets hit a specific level
The spread betting brokers in the list below provide clients with access to real time charts and prices:
- City Index (read review)
- ETX Capital (read review)
- Financial Spreads (read review)
- Finspreads (read review)
- IG (read review)
- Inter Trader (read review)
- Spreadex (read review)
Where Can I Trade Commodities for Free?
Investing always comes with a degree of risk. Having said that, if you want to try a free Test Account, that allows you to practice your spread betting, see Free Demo Account below.Furthermore, financial spread betting in the UK is tax free*, i.e. there is no stamp duty, income tax or capital gains tax.
If you are looking for a free commodities trading platform, keep in mind that you can spread bet on commodities futures without having to pay any commissions or brokers’ fees through companies such as:
Free Demo Account
If you are looking for a free Practice Account where you are able to try out financial spread betting, and trading markets like coffee, gold and crude oil, then you can always have a closer look at:The above spread trading firms currently offer a risk free Test Account that lets investors practice their trading, analyse professional charts and try out new ideas.
Individual Commodities Spread Betting Guides
Below we have listed guides to the main commodities spread betting markets.The first table shows the more popular markets and each guide has real-time prices and charts as well as regular market updates and analysis.
All of our commodity guides have worked trading examples and answer popular questions such as:
- Where can I spread bet?
- Where can I get live prices / charts?
- Where can I trade commission free?
- Where can I practice trading?
- Etc.
| Metals | Energies | Softs / Agricultures |
| Gold Trading Guide | Crude Oil Trading Guide | Coffee Trading Guide |
| Silver Trading Guide | Natural Gas Trading Guide | |
| Copper Trading Guide |
Below, guides covering the less popular commodities. Investors should take extra care when speculating on these markets. Spread betting is always a high risk form of trading however the following:
- Are less popular and therefore the ‘spreads’ tend to be wider i.e. the underlying market has to move further, than a highly traded market, before you can close out your trade for a profit
- Can be more volatile and more likely to ‘slip’ or ‘gap’ than popular, and liquid, markets like gold and crude oil.
How to Spread Bet on Commodities
The futures market started with agricultural commodities. Farmers and producers would try to hedge their incomes against future events.Commodities markets are influenced by rumours of poor weather, low yield harvests and global demand fluctuations. Therefore commodity trading offers some of the most volatile spread bets.
As with a variety global markets, you can spread bet on commodities to rise or fall.
- How to Spread Bet on Commodities: Gold Daily Example (buy)
- How to Spread Bet on Commodities: Crude Oil Futures Example (buy)
- How to Spread Bet on Commodities: Crude Oil Futures (sell)

Commodities Rolling Daily Example – Buying Gold
Most commodities markets are ‘futures’ markets. However, with spread betting, the most popular gold market is normally the ‘daily’ gold market. See below for a worked commodities futures example.Looking at CapitalSpreads, we can see they are currently pricing the ‘Gold Rolling Daily’ market at $1,761.5 – $1,761.9.
Therefore you can spread bet on gold:
 Moving above $1,761.9, or
 Moving below $1,761.5
When spread betting on gold you trade in £x per $0.1. As a result, if you decided to risk £3 per $0.1 and gold moves $3.0 then that would alter your profit/loss by £90. £3 per $0.1 x $3.0 = £90.
Rolling Daily Commodities Markets
Again, note that this is a Rolling Daily Market. So in contrast with commodities futures markets, there is no expiry date. If your trade is still open at the end of the day, it will roll over into the next trading day.If your position does roll over and you are spread betting on the market to:
 Move up – then you’ll normally be charged a small financing fee, or
 Move down – then you will often receive a small credit to your account
For a fully worked example please see Rolling Daily Spread Betting.
Gold Rolling Daily – Commodity Spread Betting Example
If we take the spread of $1,761.5 – $1,761.9 and make the assumptions that:- You have done your analysis of the metals market, and
- Your analysis leads you to believe that gold will move above $1,761.9
So, you gain £2 for every $0.1 that gold moves higher than $1,761.9. However, this trade also means that you will make a loss of £2 for every $0.1 that the gold market drops below $1,761.9.
Thinking of this in a slightly different way, should you ‘Buy’ a spread bet then your profit/loss is found by taking the difference between the closing price of the market and the price you bought the spread at. You then multiply that difference in price by the stake.
Should the market rise to $1,768.5 – $1,768.9, you might decide to close your spread bet and take your profit.
To close your position, you would sell at $1,768.5:
Profit = (Closing Level – Opening Level) x stake
Profit = ($1,768.5 – $1,761.9) x £2 per $0.1
Profit = $6.6 x £2 per $0.1
Profit = £132 profit
Trading commodities won’t always go to plan. In this example, you had bet that the gold market would rise. Of course, the precious metal might fall.
If gold fell, you could choose to limit your losses by closing your spread bet.
If we continue the example, but with the commodity dropping to $1,756.1 – $1,756.5, then you could choose to close your trade by selling at $1,756.1. This would give you a loss of:
Loss = (Closing Level – Opening Level) x stake
Loss = ($1,756.1 – $1,761.9) x £2 per $0.1
Loss = -$5.8 x £2 per $0.1
Loss = -£116 loss
Gold Rolling Daily market correct as of 20-Sep-12.

Commodities Futures Example – Buying Crude Oil
If we log into Inter Trader, we can see they are offering the US Crude Oil November Futures market at $91.50 – $91.54.This means an investor could spread bet on US Crude Oil:
 Finishing higher than $91.54, or
 Finishing lower than $91.50
On the settlement date for this ‘November’ market, 17-Oct-12.
If you spread bet on US Crude Oil you trade in £x per $0.01.
E.g. should you choose to invest £5 per $0.01 and US Crude Oil moves $0.34 then there would be a difference to your P&L of £170. £5 per $0.01 x $0.34 = £170.
So, if we take spread of $91.50 – $91.54 and assume a) You have done your analysis, and b) You feel that the US Crude Oil market will finish higher than $91.54 by 17-Oct-12, then you could opt to buy a spread bet at $91.54 and trade, for the sake of argument, £4 per $0.01.
Therefore, you make a profit of £4 for every $0.01 that US Crude Oil pushes above $91.54. Having said that, such a trade also means that you will lose £4 for every $0.01 that the US Crude Oil market falls below $91.54.
Looked at another way, if you buy a spread bet then your profit/loss is calculated by taking the difference between the closing price of the market and the price you bought the market at. You then multiply that price difference by the stake.
As a result, if, on the expiry date, US Crude Oil finished at $91.77, then:
P&L = (Closing Value – Opening Value) x stake
P&L = ($91.77 – $91.54) x £4 per $0.01
P&L = $0.23 x £4 per $0.01
P&L = £92 profit
Speculating on commodity futures, by spread betting or otherwise, does not always result in a profit. With this example, you wanted the oil futures market to increase. Naturally, the futures market might decrease.
If US Crude Oil had fallen and closed at $91.27, you would end up losing this spread bet.
P&L = (Closing Value – Opening Value) x stake
P&L = ($91.27 – $91.54) x £4 per $0.01
P&L = -$0.27 x £4 per $0.01
P&L = -£108 loss
Note – US Crude Oil November Futures commodities market accurate as of 20-Sep-12.
How to Spread Bet on Commodities Futures to Fall – Selling Crude Oil
The price of Brent crude is stable but you think it will have another price correction from the current price of around $60.30 per barrel.You check a spread betting company’s website and see the September quote is 60.32 to 60.44, and is traded per $0.01.
You decide to sell at £3 per $0.01 at $60.32. Let’s say your forecast is good and the price of oil falls. Your position closes at expiry at $58.52.
Your profit / loss is calculated by calculating the difference between the closing level ($58.52) and the opening price ($60.32) and multiplying it buy your stake.
Profit on day = ($60.32 – $58.52) x £3 per $0.01 stake
Profit on day = $1.80 x £3 per $0.01
Profit on day = £540 profit
However had oil demand increased and reignited the oil bull market the price could have closed at, let’s say, $62.02 you would have lost.
Loss = ($60.32 – $62.02) x £3 per $0.01 stake
Loss = -$1.70 x £3 per $0.01
Loss = £510 loss
Brent crude oil spread betting market as of July 2009.
Advert:
Commodities Spread Betting Guide, sponsored by FinancialSpreads.com.
You can spread bet on Commodities with Financial Spreads.
You can spread bet on Commodities with Financial Spreads.
Commitments of Traders Commodities Reports
When studying the US Commodity Futures Trading Commission COT reports, many investors concentrate on the Non-Commercial commitments and the Change in Open Interest. Therefore we publish the following ‘Summary Non-Commercial and Open Interest COT Reports’ every week.For the full COT report for a particular commodity, and to see how traders are changing their positions in that futures market, simply click on the relevant link in the summary tables below.
Unfortunately we don’t currently produce COT reports for oats or rough rice, however we still cover these commodities in the summary tables below.
We also have gold and silver COT charts, or for more details about these, reports see our guide to the Commitments of Traders reports.
Summary Metals Non-Commercial and Open Interest COT Report – 15 May 2018 |
| Metals | Net Non-Commercial Commitments (i) (Futures Only) | Open Interest (i) | Change in Open Interest (i) | |||
| Long:Short Ratio (i) | 15 May 2018 | 8 May 2018 | Weekly Change | |||
| Gold | 1.8:1 | 92,443 | 107,440 | -14,997 | 519,958 | 28,560 |
| Silver | 1:1 | 658 | -121 | 779 | 198,065 | 2,200 |
| Copper Grade #1 | 1.5:1 | 36,355 | 33,452 | 2,903 | 258,587 | 4,753 |
| Palladium | 4.6:1 | 10,684 | 10,296 | 388 | 23,876 | 1,425 |
| Platinum | 1.2:1 | 8,196 | 10,388 | -2,192 | 80,140 | -271 |
Summary Energies Non-Commercial and Open Interest COT Report – 15 May 2018 |
| Energies | Net Non-Commercial Commitments (i) (Futures Only) | Open Interest (i) | Change in Open Interest (i) | |||
| Long:Short Ratio (i) | 15 May 2018 | 8 May 2018 | Weekly Change | |||
| Crude Oil (US Light Sweet) | 6:1 | 644,444 | 679,928 | -35,484 | 2,706,454 | 48,225 |
| Gasoline (RBOB) | 2:1 | 95,919 | 84,753 | 11,166 | 477,684 | 8,969 |
| Heating Oil No. 2 | 1.5:1 | 42,070 | 32,460 | 9,610 | 448,472 | 24,896 |
| Natural Gas | 1:1.3 | -93,428 | -124,023 | 30,595 | 1,492,387 | 37,764 |
Summary Softs Non-Commercial and Open Interest COT Report – 15 May 2018 |
| Softs | Net Non-Commercial Commitments (i) (Futures Only) | Open Interest (i) | Change in Open Interest (i) | |||
| Long:Short Ratio (i) | 15 May 2018 | 8 May 2018 | Weekly Change | |||
| Cocoa | 2:1 | 57,387 | 53,948 | 3,439 | 305,050 | -163 |
| Coffee C (Arabica) | 1:1.6 | -34,518 | -27,964 | -6,554 | 257,849 | 15,419 |
| Corn | 2.8:1 | 394,310 | 412,153 | -17,843 | 1,831,023 | 38,219 |
| Cotton No. 2 | 8.3:1 | 109,925 | 118,363 | -8,438 | 282,944 | -3,457 |
| Lean Hogs | 1:1.2 | -14,672 | -14,258 | -414 | 243,279 | -5,359 |
| Live Cattle | 1.1:1 | 11,304 | 18,061 | -6,757 | 358,064 | -2,466 |
| Oats | 1:1.2 | -214 | -58 | -156 | 5,584 | -28 |
| Orange Juice | 3.1:1 | 3,293 | 1,979 | 1,314 | 15,149 | 1,868 |
| Rough Rice | 2.5:1 | 994 | 1,337 | -343 | 8,143 | -783 |
| Soybeans | 2.7:1 | 155,648 | 172,647 | -16,999 | 878,836 | 26,785 |
| Sugar No. 11 | 1:1.4 | -88,311 | -95,605 | 7,294 | 1,028,716 | 28,649 |
| Wheat | 1.2:1 | 22,644 | 31,503 | -8,859 | 470,717 | 1,638 |
Case Study: Applying Technical Analysis to Precious Metals
Below, an older but still useful case study on precious metals futures by Shai Heffetz, InterTrader, 27-Oct-2011.Gold futures reached $1,720 per ounce briefly during Asian trading on Wednesday 26 October 2011.
This was its highest level in more than a month but by lunchtime in London the yellow metal had already eased back to about $1,700 per ounce.
The silver spread betting market also climbed; in fact, it has now gained more than 13% when compared to the price one month ago.
News that European finance ministers decided to cancel a meeting scheduled for Thursday 27 October saw the price of gold surge with more than 3% over the course of three hours on Wednesday afternoon. This was despite the fact that the planned summit of EU leaders was still scheduled to go ahead.
At the same time, the US S&P 500 index dropped by 2%. Gold traders in London were quoted as saying that it was the first time in weeks that gold had traded inversely to shares.
Spread Betting Analysis on Precious Metals
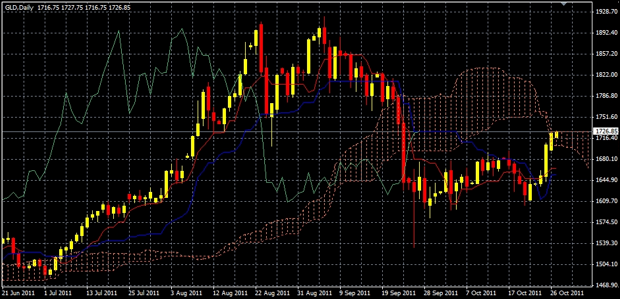
If we look at the daily gold candlestick chart below we can see that gold briefly touched $1921 on 6 September before virtually collapsing to $1532.65, which was the lowest price on 26 September. It recovered significantly during the day and closed at $1626.40.After that, we saw a period where the price moved mainly sideways, but on 23 October, it broke through the blue Kijun Sen line and since then we have experienced a mini bull run. Right now, on the 27 October, it trades at $1726.
The price has moved into the ‘wait-and-see’ area of the Ichimoku Kinko Hyo cloud. Any significant break above the cloud might be the start of a new bull run, but if it closes below the recent low of $1603.25 it reached on 20 October, we might see further drops in the price.
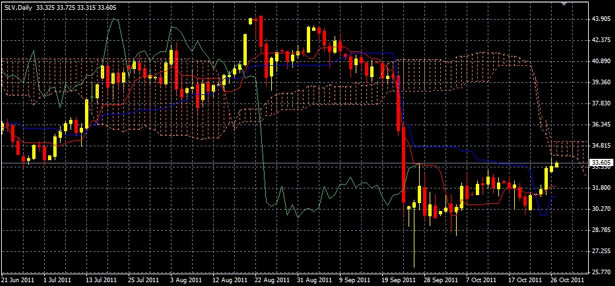
On the daily silver chart below, we can see that silver also dropped significantly during September, mainly on the 22nd and 23rd, when the price dropped from nearly $40 to close at $30.805 on the 23rd.
Since then it has recovered somewhat and is now trading at $33.645. Commodities analysis suggests that we need the price to break through the Ichimoku cloud before a long trade becomes advisable. Any new low could well be the start of a new bear phase.
Precious Metal Safe Havens?
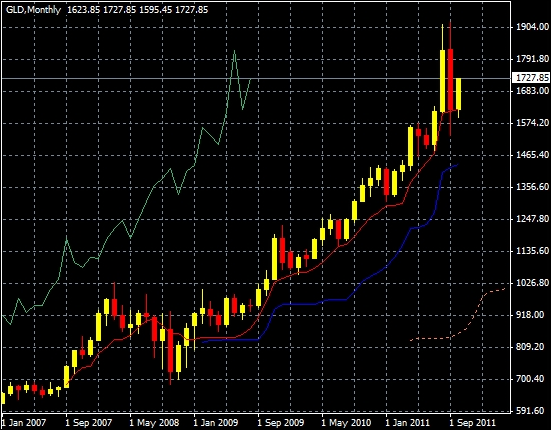
The question is often asked nowadays whether gold and silver are still ‘safe havens’ or not. It can best be answered by referring to monthly charts below.On 1 January 2007, the gold market opened at $607.85. The current price of $1,726 represents a growth rate of close to 184% over 58 months.
The recent price correction suddenly does not look so bad at all and the long-term prospects remain very positive.
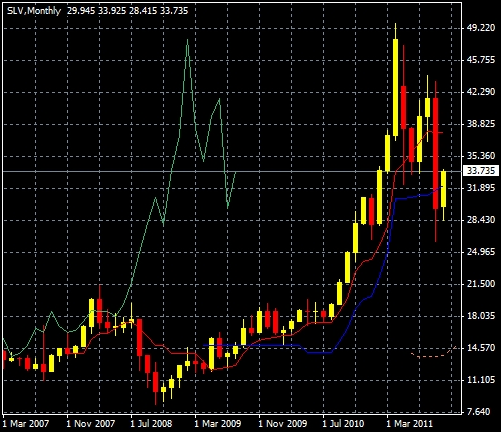
Silver started at $14.24 on 1 March 2007. The current price of $33.625 represents growth of 136% over a period of 56 months; not quite as good as gold, but much better than what can be said of most stock exchanges.
Having said that, the price of silver has dropped significantly since May. A longer-term trader should probably wait for it to recover to a level above the blue Kijun Sen and red Tenkan Sen lines on the chart below before going long again.
Case Study: Applying Fundamental and Technical Analysis to Energies
Below, an older but still useful case study on the oil market by Shai Heffetz, InterTrader, 23-Mar-2011.At the moment, the oil market appears to be in something of a state of turmoil. There are certain forces at play that will push prices up for the foreseeable future; yet recent events have created a situation that could have a dampening effect on prices, at least in the short to medium term.
Crude Oil Fundamental Analysis
On the demand side, large economies, such as India and China, are still growing strongly. If this trend continues, it will ensure constant growth in the demand for crude oil in the short to medium term.On the other hand, economic activity in many important Western economies is still lacklustre.
Despite several predictions of an imminent upturn, the US and UK economies have not lived up to expectations, which will, to a large extent, keep demand for crude oil in check. The upcoming summer months in the northern hemisphere will also act to keep demand for oil within reasonable limits during that period.
A number of countries have suffered crippling natural disasters in the past few months. The earthquake and subsequent tsunami in Japan was no doubt the worst of these and has now raised fears of a recession in one of the world’s biggest economies.
Once the focus shifts from immediate need to rebuilding, the construction industry in Japan will no doubt receive a huge boost. This will, in turn, lead to stronger demand for various imported commodities and stimulate economic activity, and the demand for crude oil will increase.
The latest unrest in various crude oil producing countries of the Middle East/North Africa (MENA) region has created fear of disruption to the oil supplies.
This situation has been exacerbated by recent developments in Libya, where a civil war could potentially break out after military intervention by Western powers. This will lead to further upward pressure on the price of crude oil.
Something else that has to be taken into account is that the threat of a nuclear disaster in Japan has made many nuclear powers rethink their approach towards this form of energy. Germany, for example, has already decided to close several of its older nuclear power stations.
Since nuclear energy is an alternative to oil, any development that curtails the supply of this alternative energy source will, in the long run, act to stimulate the demand for crude oil and push the price up even further.
What we will probably see in the short to medium term therefore, is a temporary lull in the demand for oil. In the medium to long term, everything points to higher oil prices and it would not be surprising to see new record prices within the next two years.
Crude Oil Technical Analysis
Technical analysis of the situation seems to confirm the foregoing conclusions.The market was in a strong bull run before the earthquake in Japan on 11 March 2011, but since then there has been a significant price correction, because many traders feared an imminent recession in Japan. The market reached a low on 15 March, with Brent Oil closing at $108.28.
At its lowest level, the price moved marginally below the Kijun Sen (the blue line) on the Ichimoku Kinko Hyo, but rebounded sharply from there and right now it is trading above both the blue line (Kijun Sen) and the shorter-term average, the Tenkan Sen (the red line).
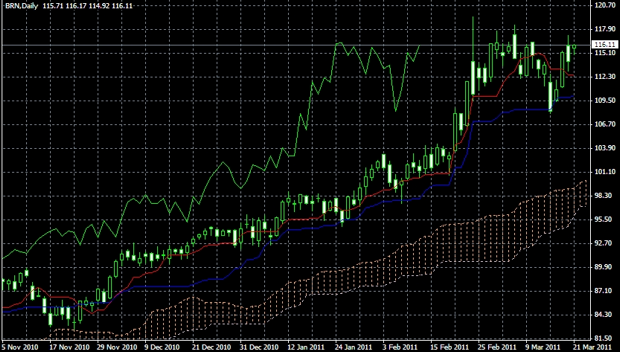
The above Ichimoku Kinko Hyo cloud currently indicates a clear bull market.
The Chinkou Span (the green line) is above the price of 21 days ago; the price is well above the cloud and also above both the blue and red lines of the Kijun Sen and Tenkan Sen.
A possible strategy is therefore to buy Brent with a stop loss placed at the red Tenkan Sen line. Along with the Ichimoku Kinko Hyo, this line always acts as your first level of support. Once the price breaks through the blue Kijun Sen, a long position is no longer advisable.
The first resistance level is at $118.47, which was reached on 7 March. Once the price breaks through that level, watch out for $119.40, a previous high that was reached on 24 February. If the price breaks through this level, new highs are very possible.
As long as the price is above the cloud of the Ichimoku Hyo, medium term short trades cannot be advised. This does not mean, however, that an astute day trader cannot make money from short-term corrections in the price. In this instance, the chart above should be redrawn using an hourly or even shorter-term chart.
The same rule applies when the price is trading above the cloud; take in a long-term position. When it is in the cloud, stay out of the market and when it trades below the cloud, it is time to go short.
Potash Trading
Market update, 30 July 2013.The $20bn global market for potash, the crop nutrient, is now set to become freely traded for the first time in 8 years.
This follows a surprise announcement yesterday from Uralkali, the biggest global supplier. Uralkali intend to end product restrictions which previously underpinned global prices.
For more details, read the Reuters article Uralkali quits potash cartel.
Editor’s note – it may take a while before you can spread bet on potash futures, don’t hold your breath. If and when the market opens, the spreads are likely to be rather wide.
Spread betting and CFD trading carry a high level of risk to your capital and you may lose more than your initial investment. Spread betting and CFD trading may not be suitable for all investors. Only speculate with money that you can afford to lose. Please ensure you fully understand the risks involved and seek independent financial advice where necessary.


