The CleanFinancial.com guide to crude oil spread betting.
- Crude Oil Price Comparison
- Where Can I Spread Bet on Crude Oil?
- Where Can I Trade Crude Oil for Free?
- Where Can I Practice Trading Crude Oil?
- Live Crude Oil Charts
- Live Crude Oil Prices
- How to Spread Bet on Crude Oil?
- Crude Oil Commitments of Traders Report
- Commodities Spread Betting Guide
- Case Study: Crude Oil Supply and Demand
- Case Study: Applying Fundamental and Technical Analysis to Oil
- Case Study: Applying Technical Analysis to Crude Oil
- Crude Oil Tips for Beginners
Live Crude Oil Chart & Prices
The CFD trading chart and prices below will give readers a helpful guide to the silver market.Crude Oil Spread Comparison
A spread/price comparison table looking at the ‘spread size’ and minimum stakes for crude oil futures.Comparison Notes. This table is not meant to be inclusive, crude oil spread betting may be available through other companies.
Crude Oil Market Analysis & News |
5 May 2018, 12:56pm, Updated US Crude Oil COT Report
The latest Commitments of Traders Report (COT) for US Crude Oil has been released by the CFTC, see our US Crude Oil COT report below.
We have also updated our Commodities COT Summary Report.
The latest Commitments of Traders Report (COT) for US Crude Oil has been released by the CFTC, see our US Crude Oil COT report below.
We have also updated our Commodities COT Summary Report.
5 May 2018, 8:17pm, Updated US Crude Oil COT Report
The latest Commitments of Traders Report (COT) for US Crude Oil has been released by the CFTC, see our US Crude Oil COT report below.
We have also updated our Commodities COT Summary Report.
The latest Commitments of Traders Report (COT) for US Crude Oil has been released by the CFTC, see our US Crude Oil COT report below.
We have also updated our Commodities COT Summary Report.
This content is for information purposes only and is not intended as a recommendation to trade. Nothing on this website should be construed as investment advice.
Unless stated otherwise, the above time is based on when we receive the data (London time). All reasonable efforts have been made to present accurate information. The above is not meant to form an exhaustive guide. Neither CleanFinancial.com nor any contributing company/author accept any responsibility for any use that may be made of the above or for the correctness or accuracy of the information provided.
Unless stated otherwise, the above time is based on when we receive the data (London time). All reasonable efforts have been made to present accurate information. The above is not meant to form an exhaustive guide. Neither CleanFinancial.com nor any contributing company/author accept any responsibility for any use that may be made of the above or for the correctness or accuracy of the information provided.
Where Can I Spread Bet on Crude Oil?
Investors can speculate on both Brent Crude Oil futures and US Crude Oil futures through an account with these spread betting companies:Note that you may also be able to speculate on crude oil via other platforms.
Professional Level Charts for Crude Oil Trading
Although the charts differ across the various platforms, to aid your crude oil analysis, the charts usually come with useful features and tools e.g.:- A host of different intervals e.g. 1 minute, 2 minutes, 30 minutes, 1 hour, 1 month etc.
- Tools for adding features e.g. Fibonacci time zones, fans and arcs
- A variety of display styles e.g. bar charts and candlestick charts
- Overlays and indicators e.g. Bollinger Bands, Moving Averages, Relative Strength Index, True Strength Index etc.
- BackTesting and Optimisation functions
- Automatic email notifications for when a market hits a pre-determined level
The brokers listed below all provide account holders with live prices and charts:
- City Index (read review)
- ETX Capital (read review)
- Financial Spreads (read review)
- Finspreads (read review)
- IG (read review)
- Inter Trader (read review)
- Spreadex (read review)
Advert:
Crude Oil Spread Betting Guide, sponsored by FinancialSpreads.com.
You can spread bet on Crude Oil with Financial Spreads.
You can spread bet on Crude Oil with Financial Spreads.
Where Can I Trade Crude Oil for Free?
Investing always involves a degree of risk. Nevertheless, if you would like to open a free Demo Account that lets you practice your financial spread betting, then see Free Demo Account for further details.When deciding which investment option might work for you, don’t forget that in the UK, spread betting is currently exempt from capital gains tax, stamp duty and income tax*.
If you are looking for a free commodities trading platform then you should keep in mind that you can financial spread bet on oil futures without having to pay any brokers’ fees or commissions with:
Free Demo Account
If you want to have a go with a Practice Account where you can get used to spread betting on the crude oil markets, then have a look at:The above companies offer a free Demo Account which lets users practice trading, review charts and try out new strategies.

How to Spread Bet on Crude Oil?
As with many global markets, it is possible to spread bet on commodity markets, like Brent Crude Oil and US Crude Oil, to either rise or fall. Readers should note that some platforms refer to ‘Brent Crude Oil’ as ‘UK Crude Oil’.If we look at Financial Spreads, we can see they are currently showing the Brent Crude Oil November Futures market at $107.56 – $107.60. Therefore, an investor could spread bet on Brent Crude Oil:
 Closing above $107.60, or
 Closing below $107.56
On the settlement date for this ‘November’ market, 15-Oct-12.
When putting a spread bet on Crude Oil you trade in £x per $0.01. So, should you decide to risk £3 per $0.01 and the Crude Oil market moves $0.31 then that would be a difference to your profits (or losses) of £93. £3 per $0.01 x $0.31 = £93.
Crude Oil Futures Example
So, if we take the above spread of $107.56 – $107.60 and make the assumptions:- You have done your analysis of the oil markets, and
- You feel that the Brent Crude Oil market will close above $107.60 by 15-Oct-12
You gain £3 for every $0.01 that Brent Crude Oil increases higher than $107.60. Nevertheless, you will lose £3 for every $0.01 that the Brent Crude Oil market decreases lower than $107.60.
Looked at another way, should you ‘Buy’ a spread bet, your profits (or losses) are found by taking the difference between the closing price of the market and the opening price you bought the spread at. You then multiply that difference in price by the stake.
With that in mind, if, on the settlement date, the Brent Crude Oil futures market closed at $108.08, then:
Profit / loss = (Closing Price – Opening Price) x stake
Profit / loss = ($108.08 – $107.60) x £3 per $0.01
Profit / loss = $0.48 x £3 per $0.01
Profit / loss = £144 profit
Crude oil spread betting is never straightforward. In the above example, you wanted the futures market to rise. Of course, the futures market might fall.
If Brent Crude Oil decreased and settled lower at $107.18, then you would end up making a loss and losing money on this trade.
Profit / loss = (Closing Price – Opening Price) x stake
Profit / loss = ($107.18 – $107.60) x £3 per $0.01
Profit / loss = -$0.42 x £3 per $0.01
Profit / loss = -£126 loss
Note: Brent Crude Oil November Futures market correct as of 20-Sep-12.
Crude Oil Tips for Beginners
- If you are new to trading crude oil then you can always start trading using a Demo Account or Practice Account. Spread betting companies like FinancialSpreads.com and Capital Spreads offer a free Demo (Practice) Account that is based on their actual trading platform. In this case they put a virtual £10,000 in your Demo Account. The demo prices are sometimes delayed by 15 minutes but that should be fine if you are just practicing
- Make sure you trade for free ie without commissions or broker fees. With spread betting you can normally trade crude oil without any such fees
- Trade crude oil tax free. If you spread bet on the oil markets you get all the normal spread betting benefits and any profits you make from trading crude oil, whether you buy or sell, are tax free*
- You can get the weekly US crude oil inventory numbers on Wednesday afternoons from the US Energy Information Administration. However for a quick and easily digestible update, I prefer the Market Squawk service. This is free for account holders with firms like Financial Spreads, Capital Spreads and InterTrader.
- The price of crude oil changes very quickly and it can be difficult to compare crude oil prices. However, at Clean Financial, we let investors compare the spreads on offer – see our spread comparison above
- If you are less comfortable with the crude oil markets or with spread betting, the best form of keeping your funds safe is not to speculate. If you do not trade you will not lose any spread bets. Of course that means you cannot profit either. Again a Demo account can be a good place to start
- So you want to trade but are worried about the potential losses? Then trade with small stakes. Most firms will let you trade with as little as £1 per cent ($0.01). So if the price of Crude goes up or down 50¢ you will win or lose £50 depending upon whether you bought or sold the market. If the price shoots up $1.75 per barrel or drops $1.75 again you would win or lose $175 cents x £1 per ¢ = £175
Likewise if you bet £2 per ¢ and the market moves $1.25 then you would win / lose $125 cents x £2 per ¢ = £250
See above for a fully worked explanation - Protection. You can also use Stop Losses and Guaranteed Stop Losses to protect yourself against big swings. These are ways of telling the online spread betting company to close your bet if the market moves against you. Some of the companies operate these in slightly different ways so check with your spread betting firm for details but essentially it works like this:
You are happy to risk £200 on a crude oil trade. So you place a spread bet, for let’s say £1 per cent with a Stop Loss set so your maximum loss is £200. ie the price of Oil can move $2 against your position before your bet is closed
Some companies like financialspreads.com will not close your bet if the market moves in your favour. For example, if Crude moves a lot eg $2.75 (275¢) then:
a) If it moves the way you bet by $2.75 then you would win 275 x £1 = £275,
b) If it moves against the way you bet by $2.75 your bet would be Stopped at $2 and you would only lose you 200 x £1 = £200
The penalty for this security is a slightly wider spread but the peace is mind is sometimes worth it. Note that a Guaranteed Stop Loss is ‘Guaranteed’. However a Stop Loss is ‘Not Guaranteed’ at the level you specify. If the markets move quickly or gap through prices then your Stop Loss may activated at the next price eg $2.12 rather than $2
Case Study: Crude Oil Supply and Demand Factors
We wrote the article below in July 2008 but even 5 years later we think it’s a good case study of how and why the futures market can move.Many column inches written about the current crude oil bull market. However even during this bull run there have been many ups and downs. Especially during the last 4 to 6 weeks.
So we thought we would have a look at recent events that have actually made a difference to the prices at Financial Spreads.
- One of the basic underlying trends has been the strength of the dollar. This is not a surprise. Crude Oil in traded in dollars per barrel, all things being equal, Crude Oil tends to follow the US Dollar exchange rates trends. If the US Dollar depreciates in value against the Euro and / or Pound then the price of Crude will often go up and vice versa. In the last month the US Federal Reserve hinted at raising interest rates = possibility of a stronger dollar = crude oil price decrease
- The European Central Bank and Bank of England then stated that fighting inflation was more important than growth = possible interest rates rises in Europe = stronger pound and euro = weaker dollar = crude oil price up
- The flight to safety. Normally that means gold, in this case, black gold. In times of uncertainty investors often put their money into gold. In this case with the price of gold looking high and possibly on the way down investors have put their money, as one would expect, in to bonds. They have also been speculating on Crude Oil. That has led to upwards pressure on the price
- A well known analyst or bank predicting a change in price can have a strong affect. In this case Goldman Sachs energy strategist Argun Murti warned Nymex Crude could have a ‘super spike to $200’. It was Murti who correctly predicted that crude would hit $100 per barrel. His prediction has meant more upwards pressure on the price
- Long-terms trends and more speculators. Crude prices have now risen by 25% in the last four months and 400% since 2001. Many speculators will jump on the band wagon
- News of lower Crude Oil subsides. As a number of countries in Asia said they were cutting back on local subsidies that decreased expected depend = fall in crude oil trading prices
- Israel made hawkish comments about Iran. Conflict in the Middle East causes supply problems. Therefore this increased threat to supply pushed Crude up
- Economic Indicators, the weekly US crude oil inventory numbers usually come out at 1530 (BST) on a Wednesday. If the storage numbers are lower than expected = lower supply = increased price and vice versa
- Consumptions numbers are clearly also important. Lower than expected consumption = lower demand = lower price
- OPEC. In May OPEC said that there were sufficient supplies of crude oil and that an increase in production was unlikely. That led to supply fears and helped push crude oil to a record high in excess of $135
- A slowing global economy. No surprises here. There is a lot of press about a slowing economy and when that is coupled with Company Results showing a slow down and/or Economic Indicators showing a possible slow down = lower consumption going forward = lower demand = lower price
- An Earthquake in China sparked energy shortage fears after several hydro-electric power stations were damaged = higher demand for oil = higher crude oil price
- The Saudis said that they would increase oil production = higher supply = lower price
- A less well known area surfaced in a report in the Financial Times, news of refineries paying record premiums for high quality crude oil. In this case the Refineries are paying a higher price for current supply than the futures prices. The FT reported some refiners paying $5-6 on top of the traded price for high quality oil. Of course this is a difficult area to take into account in your speculating. There is a lot of data regarding the prices traded at ICE (Brent Crude) and Nymex (US Crude) but data regarding refinery pricing is not as widely available
However the above also highlights why crude oil trading is so popular. There are many opportunities to make a profit (and loss).
Crude Oil (US Light Sweet) Commitments of Traders Report – 15 May 2018 (i)
Futures Only Positions, NYME, Code 67651, (Contracts of 1,000 barrels) (i)| Reporting Firms (i) | Non-Reportable Positions (i) | ||||||||
| Non-Commercial (i) |
Commercial (i) | Total Reportable (i) | |||||||
| Commitments (i) | Open (i) Interest | Commitments | |||||||
| Long (i) | Short (i) | Spreads (i) | Long | Short | Long | Short | Long | Short | |
| 772,511 | 128,067 | 933,001 | 882,946 | 1,557,321 | 2,588,458 | 2,618,389 | 2,706,454 | 117,996 | 88,065 |
| Changes from 8 May 2018 (i) | Change in (i) Open Interest | Changes from | |||||||
| Long | Short | Spreads | Long | Short | Long | Short | Long | Short | |
| -32,295 | 3,189 | 46,849 | 26,466 | 2,501 | 41,020 | 52,539 | 48,225 | 7,205 | -4,314 |
| Percent of Open Interest for Each Category of Trader (i) | |||||||||
| Long | Short | Spreads | Long | Short | Long | Short | Long | Short | |
| 28.5% | 4.7% | 34.5% | 32.6% | 57.5% | 95.6% | 96.7% | 4.4% | 3.3% | |
| Number of Traders in Each Category (i) | Total (i) Traders | ||||||||
| Long | Short | Spreads | Long | Short | Long | Short | |||
| 200 | 87 | 210 | 107 | 120 | 394 | 363 | 450 | ||
| Long/Short Commitments Ratios (i) | Long/Short Ratio | ||||||||
| Ratio | Ratio | Ratio | Ratio | ||||||
| 6:1 | 1:1.8 | 1:1 | 1.3:1 | ||||||
| Net Commitment Change (i) | |||||||||
| -35,484 | |||||||||
Also see:
Case Study: Applying Fundamental and Technical Analysis to Oil
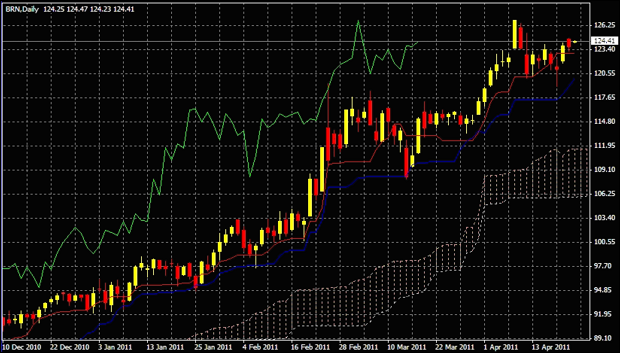
Below, an older but still useful case study on the Brent crude oil futures market by Shai Heffetz, InterTrader, 28-Apr-2011.Since reaching a low of $77 a barrel in May 2010, the price of Brent crude (UK crude) has been climbing steadily.
There are the normal corrections, probably more a result of profit taking than fundamental factors, but apart from that we can nearly draw a straight line between May last year and the current price.
Recently the price peaked at $126.88 on the 8th of April. Since then we have seen a retraction and on the 19th of April, it actually touched $119.05 for a short time before starting to increase again. The current price of $124.38 is still lower than the recent maximum, but slowly getting closer.
Brent Crude Oil Fundamental Analysis
On the demand side, various factors actually point towards lower oil prices in the medium term. In the first place, winter in the Northern Hemisphere has ended. This means that oil consumption in the world’s largest oil consuming countries, such as the USA, China and Japan, should start decreasing.Japan is also still suffering from the after-effects of the recent earthquake/tsunami disaster and manufacturing/production levels will take some time to recover, which will further soften the demand for oil from that country.
The economies in many Western countries, including the UK, USA, and Europe, are still struggling to get out of the recession. Oil demand from these economies is therefore not expected to surge suddenly.
That only leaves us with the supply side to explain the current high price of the Brent crude oil market.
Certainly, the political unrest in countries such as Libya has taken its toll, but the fact of the matter is that Libya only produces about two per cent of the world’s oil. A country such as Saudi Arabia could easily make up for the loss of the entire Libyan production.
Uncertainty has always bedevilled world markets and it seems that in this case it is once again wreaking havoc. This, combined with the fact that a large percentage of oil demand is generated by speculators is the only way to explain the surge in oil prices.
How long this will continue is hard to say. Contrary to expectations of some Western commentators, there seems to have developed a stalemate in Libya that could last for years. The political upheaval in Syria and Yemen is also not showing any signs of abating.
Brent Crude Oil Technical Analysis
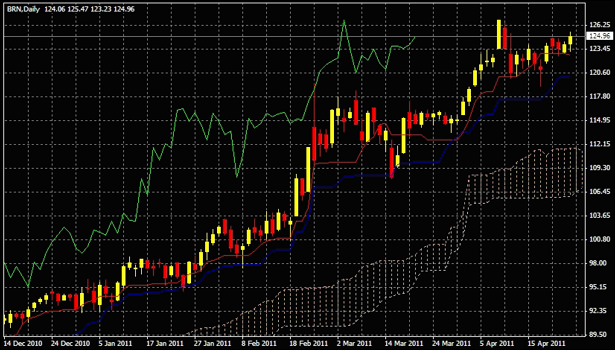
Looking the chart below, much of the analysis shouts “Bull market!”The current price is far above the cloud of the Ichimoku Kinko Hyo and the green Chinkou Span line is also high above the price 26 periods ago. In addition, the price is also well above the blue Kijun-Sen as well as the red Tenkan-Sen.
The fact that the Tenkan-Sen (red) is also above the Kijun-Sen (blue) shows us that even in the short term the bull market is still intact. The fact that the Kijun-Sen has turned flat, however, should caution traders that a short-term correction might be under way.
The current pattern seems to be similar to what we saw between mid-February and mid-March. In that case, the price eventually broke out of the correction to reach a new high on the 8th of April.
Whether this will happen again remains to be seen. If the price breaks through the recent high of $126.88, we can be fairly certain the bull market is intact.
However, if it drops below the support provided by the blue Kijun-Sen it could indicate a major price correction, so this is a good stop-loss level. If the crude oil price were to drop as far as the cloud, then getting out very quickly could be a long trader’s best option.
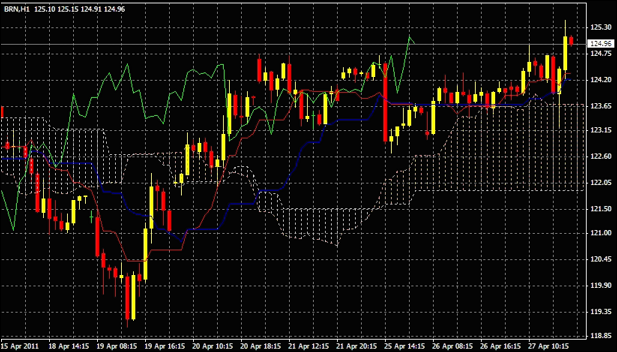
Short-term financial spread betting investors should use a shorter period, e.g. the hourly graph. In this case, it is possible to make money in the current market both during short-term corrections as well as during the subsequent upswing.
In this case, one option would be to go short when the price drops below the Ichimoku cloud and go long when it moves above the cloud.
Case Study: Applying Fundamental Analysis to Oil Crude
Below, an older but still useful case study on the Brent futures market by Shai Heffetz, InterTrader, 14-Oct-2011.On 8 April Brent crude oil briefly touched a maximum of $126.88 dollars per barrel.
Although this was just before the start of the summer season in the Northern Hemisphere, at that stage indications were that the price would show further increases in the months to come.
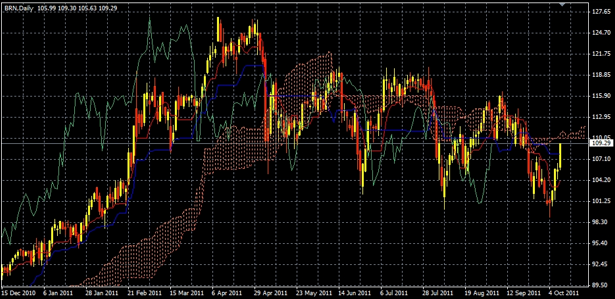
This, however, did not happen. If we look at the longer term crude oil chart below, we can see that Brent started trading downwards in a range from there.
Towards the end of May the price briefly touched the lower border of the Ichimoku cloud, only to turn around for a mini-upswing that lasted until the middle of June.
This was repeated several times during the next few months: every time the lowest and highest points were a little bit lower than before.
Turning to the shorter term candlestick chart below, we see that the price briefly touched $116.57 on 8 September before heading down again. This time it broke through the $100.00 mark and briefly touched $99.10 on the 4th of October.
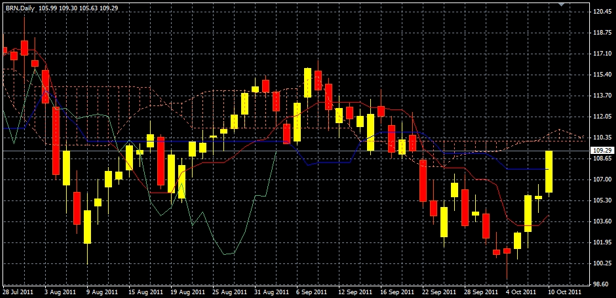
More recently, we have seen a renewed attempt by the bulls to push up the price. Currently Brent crude is trading at $109.29.
Given widespread predictions of a new recession in the major economies of the world and the ongoing Greek/European debt crisis, there seems to be little reason for a bull run in crude oil right now.
Crude oil analysis would suggest that merely breaking upwards out of the Ichimoku cloud is not enough to warrant a long trade given the range-bound price movements of the past few months. A cautious trader would wait for the price to move well above $116.00 before venturing into a long trade.
Any new low below $99.00 could be the beginning of a new bear run which short traders might want to exploit.
Example: Using Fundamental and Technical Analysis for Oil Futures
Below, an older but still useful case study on the energies futures market by Shai Heffetz, InterTrader, 27-Apr-2011.Introduction
During April 2011 we have seen a continuation of the bull market in oil.
The closing price of Brent crude on the 31st of March was $117.20, whilst on the 8th of April it reached a high of $126.88 before stabilising and at the time of writing, 27th of April, the price was at $124.96.
Fundamental Analysis of the Crude Oil Futures Market
Several market commentators have argued that the current crude oil price is driven by speculation and not by supply/demand factors.One of them is Saudi Arabia, which openly said that there is currently an oversupply in the market and hence no reason for the oil price to be increasing.
According to some of these commentators, up to 70 percent of present demand is created by speculators and not by real economic forces.
On the demand side there certainly seems to be grounds for such an argument.
Most Western economies are still struggling to get out of the recession. US oil demand for 2011 is in fact expected to be slightly lower than the 2010 figure of 19,169,000 barrels per day.
In addition, the earthquake in Japan has also severely dampened economic activity in that country and so, for the short-to-medium term, oil demand from Japan will most likely be lower than normal.
On the other hand, China and some other South East Asian countries are still going strong but there has not been an unexpected surge in demand from these countries which would explain the rises in the oil spread betting markets.
Furthermore, in the Northern hemisphere the winter is now over, which will further soften demand for oil.
This only leaves the supply side to explain the surge in oil prices.
The continuing political upheaval in MENA countries has of course created fears of a severe supply disruption, however, this has so far failed to materialise.
While Libya’s production has dropped from 1.58 million to 400,000 barrels per day, an increase in production by the UAE and to a lesser extent Angola largely compensated for this drop.
Moreover, Saudi Arabia hasn’t yet increased its production, but could easily compensate for the drop in Libyan production if it wanted to.
Technical Analysis of the Crude Oil Futures Market
Applying crude oil technical analysis to the chart below it becomes immediately clear that the bull market in oil is still intact.The correction we saw in middle March, immediately after the Japanese earthquake/tsunami, was fuelled by fears of a recession in Japan’s economy. Since then the extent of the damage has become clearer and many analysts believe that economic activity in Japan will be back to normal sooner than initially expected.
Subsequently the price of oil has moved past the high it reached before the Japanese disaster and peaked at $126.88 on the 8th or April.
The Ichimoku Kinko Hyo still clearly indicates a bull market. The price is well above the cloud and the green Chinkou Span is also above the price 26 periods ago. The red short term average (Tenkan Sen) is above the blue longer term average (Kijun Sen) and the price is above both of them, supporting the view that the bull market is intact.
Crude Oil Futures Strategies
Traders with medium term spread betting strategies can profit from the current bullish trend in the market by buying after a significant market correction and holding on at least until the price breaks downward through the blue Kijun-Sen again, which could signify the start of a major downward correction.If you had done this when the price dipped to $108.28 on the 15th of March, you would already have made a significant profit at this stage, with the price standing at $124.96. The trick of course is to correctly judge the turning point after a correction when prices will start moving upwards again.
If you are wrong, however, and you use the blue Kijun-Sen as a stop loss level, your losses will be controllable.
An alternative strategy would be to buy as soon as the market reaches a new high. In the current situation it would mean buying when prices break the $126.88 level again. Your first support level would be the red Tenkan-Sen line. As second support the blue Kijun-Sen can also serve as your stop loss level; sell when the price starts trading below that.
Following this approach, you would have bought when the price broke through the previous high of $118.47 on the 1st of April, once again realising a nice little profit up to the current level.
Investors day trading on the hourly chart for example, can of course still make money with short trades even in the current bull market.
If you had gone short on the hourly chart as shown below when the price broke down below the cloud on the 18th of April 2011, you would have made a profit if you sold again when it broke upwards through the red Tenkan-Sen line.
If you waited until it moved above the blue Kijun-Sen line, however, you would have missed most of the profit in that particular trade.
Example: Using Technical Analysis for Oil Futures
Below, another (old but useful) case study on crude futures by Shai Heffetz, InterTrader, 21-Nov-2011.Various fundamental factors, including the worldwide economic downturn and predictions of worse to come, will certainly exercise a downward pull on the price of Brent crude oil during the next few weeks.
On the other hand, in the Northern Hemisphere, winter is setting in and China’s economy is still growing strongly, which will tend to stimulate demand for oil and push the price upwards.
If we look at the candlestick chart below, which covers the price of Brent crude oil since June 2011, we can clearly see a downtrend emerging over the longer term.
There were several mini up and downswings, each lasting about three weeks, but the trend lines clearly show falling tops and bottoms.
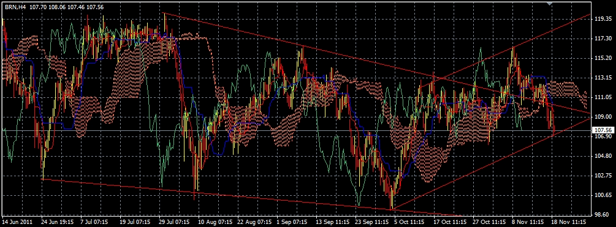
Since the beginning of October 2011, however, there seems to have been a reversal in this longer-term trend. We are seeing rising tops and rising bottoms, which could indicate that the bear market is over.
If we adhere strictly to the Ichimoku Kinko Hyo analysis, however, we are still in the grips of a bear phase.
The price is below the Ichimoku cloud, the current price is way below that of 26 periods ago and both the red Tenkan Sen and blue Kijun Sen are below the Ichimoku cloud.
A short trade is not advisable right now, since the price is approaching the recent low of $106.09 it reached on 1st November. Any close below that, however, could see the start of new lows.
Spread betting account holders looking for a long position will have to wait for a close above the Ichimoku cloud. Once we reach that level, the price might well be heading to a new high above the level of $116.41 we saw on 8th November.
Advert:
Crude Oil Spread Betting Guide, sponsored by FinancialSpreads.com.
You can spread bet on Crude Oil with Financial Spreads.
You can spread bet on Crude Oil with Financial Spreads.
Spread betting and CFD trading carry a high level of risk to your capital and you may lose more than your initial investment. Spread betting and CFD trading may not be suitable for all investors. Only speculate with money that you can afford to lose. Please ensure you fully understand the risks involved and seek independent financial advice where necessary.


