The CleanFinancial guide to Silver spread betting.
- Where Can I Spread Bet on Silver?
- Live Silver Charts
- Live Silver Prices
- Silver Trading News and Analysis
- Where Can I Trade Silver for Free?
- Where Can I Practice Trading Silver?
- How to Spread Bet on Silver?
- Commodities Spread Betting Guide
- Silver Commitments of Traders Report
- Silver Technical Analysis Case Studies
Live Silver Chart & Prices
The CFD trading chart and prices below will give readers a helpful guide to the silver market.(The chart above normally shows the near-term silver futures market.)
Where Can I Spread Bet on Silver?
You are able to trade Silver through an account with a number of spread betting firms:Please note: You may be able to take a view on silver prices on other spread trading websites.
Silver Trading News
5 May 2018, 12:56pm, Updated Silver COT Report
The latest Commitments of Traders Report (COT) for Silver has been released by the CFTC, see our Silver COT report below.
We have also updated our Commodities COT Summary Report.
The latest Commitments of Traders Report (COT) for Silver has been released by the CFTC, see our Silver COT report below.
We have also updated our Commodities COT Summary Report.
5 May 2018, 8:17pm, Updated Silver COT Report
The latest Commitments of Traders Report (COT) for Silver has been released by the CFTC, see our Silver COT report below.
We have also updated our Commodities COT Summary Report.
The latest Commitments of Traders Report (COT) for Silver has been released by the CFTC, see our Silver COT report below.
We have also updated our Commodities COT Summary Report.
This content is for information purposes only and is not intended as a recommendation to trade. Nothing on this website should be construed as investment advice.
Unless stated otherwise, the above time is based on when we receive the data (London time). All reasonable efforts have been made to present accurate information. The above is not meant to form an exhaustive guide. Neither CleanFinancial.com nor any contributing company/author accept any responsibility for any use that may be made of the above or for the correctness or accuracy of the information provided.
Unless stated otherwise, the above time is based on when we receive the data (London time). All reasonable efforts have been made to present accurate information. The above is not meant to form an exhaustive guide. Neither CleanFinancial.com nor any contributing company/author accept any responsibility for any use that may be made of the above or for the correctness or accuracy of the information provided.
Advert:
Silver Spread Betting Guide, sponsored by FinancialSpreads.com.
You can spread bet on Silver with Financial Spreads.
You can spread bet on Silver with Financial Spreads.
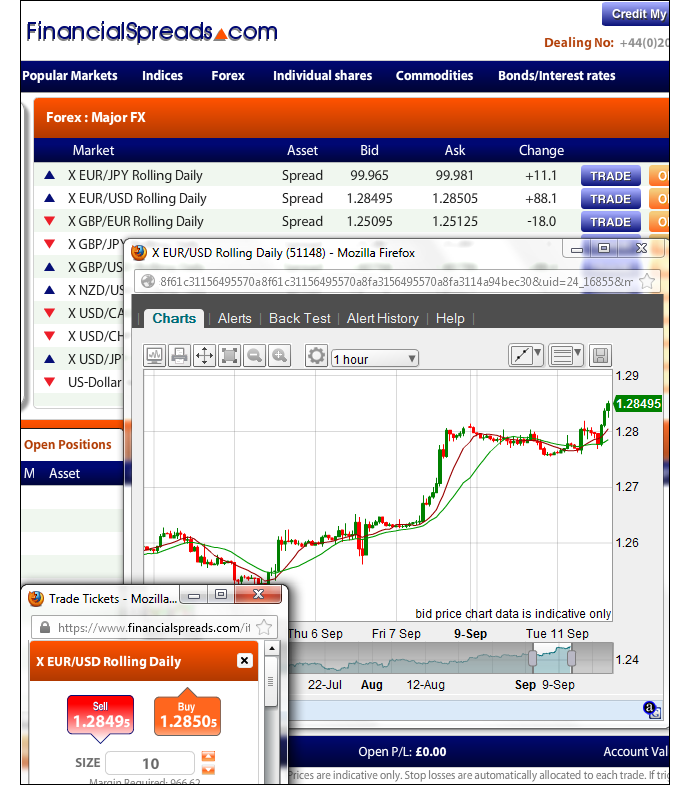
Sample Financial Spreads silver chart
The following spread betting firms give account holders live trading prices and charts:
- City Index (read review)
- ETX Capital (read review)
- Financial Spreads (read review)
- Finspreads (read review)
- IG (read review)
- Inter Trader (read review)
- Spreadex (read review)
Where Can I Trade Silver for Free?
Investing in the markets involves a degree of risk. Having said that, if you’d like to open a Demo Account, where you can try out spread betting and use charts, then please see below.When deciding which futures trading option might work for you, also remember that financial spread betting in the UK is exempt from capital gains tax, income tax and stamp duty*.
If you want a free financial spread betting website, keep in mind that investors can financial spread bet on Silver with no brokers’ fees or commissions at:
Free Demo Account
If you want to have a look at a Practice Account / Demo Account where users can try out online spread betting on markets like Silver, then have a look at:The above spread trading firms provide a free Test Account that lets investors practice with trading orders, try out new theories and analyse professional level charts.
How to Spread Bet on Silver?
As with a range of financial markets, investors can place a spread bet on commodity markets, such as Silver, to either increase or decrease.If we log on to a spread trading platform like InterTrader, we can see they are valuing the Silver December Futures market at $34.88 – $34.91. This means an investor could spread trade on Silver:
 Settling above $34.91, or
 Settling below $34.88
On the closing date for this ‘December’ market, 27-Nov-12.
When placing a spread bet on Silver you trade in £x per $0.01. Therefore, if you invest £4 per $0.01 and Silver moves $0.35 then that would alter your profits (or losses) by £140. £4 per $0.01 x $0.35 = £140.
Silver Futures Trading Example
Now, if you think about the spread of $34.88 – $34.91 and make the assumptions that:- You have completed your analysis of the silver market, and
- You feel that the Silver market will close above $34.91 by 27-Nov-12
With such a spread bet you make a profit of £2 for every $0.01 that Silver moves higher than $34.91. Conversely, however, it also means that you will lose £2 for every $0.01 that the Silver market moves lower than $34.91.
Looked at another way, if you ‘Buy’ a spread bet then your profit/loss is found by taking the difference between the settlement price of the market and the initial price you bought the market at. You then multiply that difference in price by your stake.
Therefore, if, on the closing date, Silver finished at $35.59, then:
P&L = (Settlement Level – Initial Level) x stake
P&L = ($35.59 – $34.91) x £2 per $0.01
P&L = $0.68 x £2 per $0.01
P&L = £136 profit
Speculating on commodity markets doesn’t always go to plan. In the above example, you wanted the futures market to rise. Nevertheless, the futures market could go down.
If Silver decreased, settling lower at $34.30, you would end up making a loss and losing money on this market.
P&L = (Settlement Level – Initial Level) x stake
P&L = ($34.30 – $34.91) x £2 per $0.01
P&L = -$0.61 x £2 per $0.01
P&L = -£122 loss
Note – Silver December Futures market quoted as of 18-Sep-12.
Silver Futures Trading Example 2
To help users new to trading the Silver Futures markets we have added a second trading example.On 29-Nov-07 FinancialSpreads.com were quoting the Silver (March) spread at $14.51 – $14.54.
Therefore you could spread bet on Silver settling:
 Above $14.54, or
 Below $14.51
By the expiry date of 26-Feb-08 (the expiry date for this ‘March’ futures market).
Again, for the Silver market, you trade in £X per cent, where a cent is 1¢ of Silver price movement. For example if your stake was £10 per ¢ and the price of Silver moves 7¢ then that would be a £70 difference to your profit / loss.
Taking the above spread of $14.51 – $14.54, let’s say you think the price of Silver will finish above $14.54 by 26-Feb-08.
Therefore you buy at $14.54 for a stake of, let’s say, £5 per 1¢.
If the Silver market closes at $14.73 on the expiry date, then your profit/loss is worked out by taking the difference between the price at expiry, $14.73, and the buy price of $14.54 and then multiplying that by the stake per ¢.
Profits = ($14.73 – $14.54) x £5 per ¢ stake
Profits = $0.19 x £5 per ¢
Profits = 19¢ x £5 per ¢
Profits = £95 profit
Nevertheless if the market did not move as expected and had the price of Silver fallen and finished lower at $14.38, then you would have lost.
Loss = ($14.38 – $14.54) x £5 per ¢ stake
Loss = -$0.16 x £5 per ¢
Loss = -16¢ x £5 per ¢
Loss = -£80 loss
Note: Spread betting example price quoted: 29-Nov-07.
Silver Commitments of Traders Report – 15 May 2018 (i)
Futures Only Positions, CMX , Code 84691, (Contracts of 5,000 troy ounces) (i)| Reporting Firms (i) | Non-Reportable Positions (i) | ||||||||
| Non-Commercial (i) |
Commercial (i) | Total Reportable (i) | |||||||
| Commitments (i) | Open (i) Interest | Commitments | |||||||
| Long (i) | Short (i) | Spreads (i) | Long | Short | Long | Short | Long | Short | |
| 72,663 | 72,005 | 16,450 | 78,406 | 96,472 | 167,519 | 184,927 | 198,065 | 30,546 | 13,138 |
| Changes from 8 May 2018 (i) | Change in (i) Open Interest | Changes from | |||||||
| Long | Short | Spreads | Long | Short | Long | Short | Long | Short | |
| -50 | -829 | 1,217 | 1,279 | 2,268 | 2,446 | 2,656 | 2,200 | -246 | -456 |
| Percent of Open Interest for Each Category of Trader (i) | |||||||||
| Long | Short | Spreads | Long | Short | Long | Short | Long | Short | |
| 36.7% | 36.4% | 8.3% | 39.6% | 48.7% | 84.6% | 93.4% | 15.4% | 6.6% | |
| Number of Traders in Each Category (i) | Total (i) Traders | ||||||||
| Long | Short | Spreads | Long | Short | Long | Short | |||
| 103 | 67 | 42 | 38 | 37 | 160 | 134 | 235 | ||
| Long/Short Commitments Ratios (i) | Long/Short Ratio | ||||||||
| Ratio | Ratio | Ratio | Ratio | ||||||
| 1:1 | 1:1.2 | 1:1.1 | 2.3:1 | ||||||
| Net Commitment Change (i) | |||||||||
| 779 | |||||||||
Also see:
- Silver Commitments of Traders chart
- More Commodities Commitments of Traders Reports
- Commitments of Traders Guide
Silver Technical Analysis – Case Study 1
Below, an older but nevertheless useful Silver futures case study by Shai Heffetz, InterTrader, 23-Feb-2012.A closer look at the chart below shows that silver is currently well off the maximum levels it reached towards the end of April 2011.
On 25 April last year the commodity briefly touched $49.805 before starting to fall back. Since then we have not seen anything approaching that level again. The nearest it came to that record price was $44.155 on 23 August 2011.
The current price of $34.115 is significantly lower than the average price for last year. It is also still marginally lower than the recent maximum of $35.655 we saw on 28 October last year.
Since the end of December, however, we have seen something of a bull run in the silver market. The current price is significantly higher than the minimum of $26.125 we saw on 29 December last year.
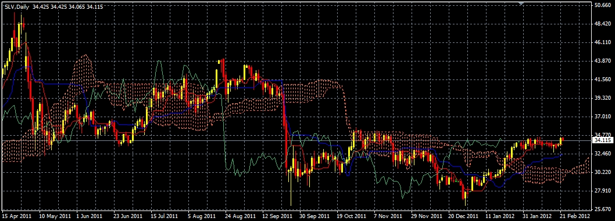
Analysis of the above chart clearly shows that the price is currently positioned above the Ichimoku cloud. The green Chinkou Span line is also situated above the price of 26 periods ago, emphasising the bull run.
Both the blue Kijun Sen and red Tenkan Sen lines are also above the cloud, which further supports the view that a bull run is under way.
Exactly how long this will last depends on whether the price can break through the previous maximum of $35.655.
A clear break above this could mean that it is heading for the next psychological barrier, the $44.155 level we saw in August last year.
If it fails to breach $35.655, expect a return to the cloud, however avoid short trades before we have seen at least two convincing closes below the cloud.
Also see our guide to Ichimoku Clouds.
Silver Technical Analysis – Case Study 2
Below, another Silver futures case study by Shai Heffetz, InterTrader, 26-Jan-2012.The first chart below is a silver candlestick chart for the past 20 months.
If we study this chart it becomes immediately clear that the commodity went through a strong bull phase between June 2010 and the end of April 2011.
On 28 April last year it briefly touched $49.525, after starting off at below $19.000 at the end of June 2010.
This rapid growth was not sustainable and despite desperate attempts by the bulls to revive the upward surge we have experienced a steady decline in the price of silver since then.
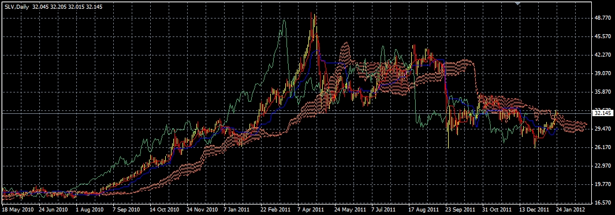
Turning to the shorter-term daily chart below, we can see that 22 and 23 September 2011 were particularly bad days for silver. During those two days the price dropped from a high of $39.825 to a low of $29.845.
The price of silver subsequently recovered somewhat, but it has never really risen significantly above the Ichimoku Kinko Hyo cloud, which would have been an indication that the bull run was about to resume.
The current price is just above the cloud, which means that, purely from a technical analysis point of view, we are experiencing something of a bull run. The green Chinkou Span line is also above the price of 26 periods ago, highlighting that there is some upward pressure in the market.
This view is further strengthened by the fact that the price is above the red Tenkan Sen line, as well as the blue Kijun Sen.
The Tenkan Sen has also recently broke through the Kijun Sen in an upwards direction, which further confirms a bull market, at least in the short term.

Whether this trend is sustainable remains to be seen. The price has not yet reached the recent high of $35.305 it briefly touched on 31 October 2011.
At least two consecutive closes above this level could be an indication that the previous bull run is about to resume.
Fundamental factors will, in the long run, support a continuation of the bull market in silver.
As with gold, silver is seen as a store of value and, while the current uncertainty in the European and American markets continue, it seems likely that the metal will eventually resume its strong growth.
Short-term Analysis
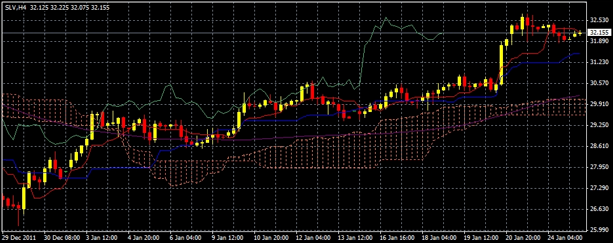
The chart below is a four-hour chart of the silver futures market. Here we can clearly see that, over the short term, we are indeed experiencing a mini bull run; the price is well above the cloud and the green Chinkou Span line sits well above the price of 26 periods ago.
With the price above the level of $32.745 it briefly touched on 23 January, a short-term long trade might well turn out to be profitable.
This could turn into a longer-term trade if the price should continue to the level of $35.305 discussed above.
Alternatively, should the price drop below the cloud in the chart below, we should accept that January’s bull run is over.
Spread betting and CFD trading carry a high level of risk to your capital and you may lose more than your initial investment. Spread betting and CFD trading may not be suitable for all investors. Only speculate with money that you can afford to lose. Please ensure you fully understand the risks involved and seek independent financial advice where necessary.


