The CleanFinancial guide to Wheat spread betting.
- Where Can I Spread Bet on Wheat?
- Live Wheat Charts
- Live Wheat Prices
- Wheat Trading News and Analysis
- Where Can I Trade Wheat for Free?
- Where Can I Practice Trading Wheat?
- How to Spread Bet on Wheat?
- Commodities Spread Betting Guide
- Wheat Trading News
- Wheat Commitments of Traders Report
Where Can I Spread Bet on Wheat?
Investors can currently spread bet without paying any commissions or brokers’ fees on Wheat, plus a wide array of similar spread trading markets, through providers such as:CleanFinancial.com readers should note that you may also be able to financial spread bet on Wheat through other providers.
Wheat Trading News
5 May 2018, 12:56pm, Updated Wheat COT Report
The latest Commitments of Traders Report (COT) for Wheat has been released by the CFTC, see our Wheat COT report below.
We have also updated our Commodities COT Summary Report.
The latest Commitments of Traders Report (COT) for Wheat has been released by the CFTC, see our Wheat COT report below.
We have also updated our Commodities COT Summary Report.
5 May 2018, 8:17pm, Updated Wheat COT Report
The latest Commitments of Traders Report (COT) for Wheat has been released by the CFTC, see our Wheat COT report below.
We have also updated our Commodities COT Summary Report.
The latest Commitments of Traders Report (COT) for Wheat has been released by the CFTC, see our Wheat COT report below.
We have also updated our Commodities COT Summary Report.
» For more see Commodities Trading News & Analysis.
This content is for information purposes only and is not intended as a recommendation to trade. Nothing on this website should be construed as investment advice.
Unless stated otherwise, the above time is based on when we receive the data (London time). All reasonable efforts have been made to present accurate information. The above is not meant to form an exhaustive guide. Neither CleanFinancial.com nor any contributing company/author accept any responsibility for any use that may be made of the above or for the correctness or accuracy of the information provided.
Unless stated otherwise, the above time is based on when we receive the data (London time). All reasonable efforts have been made to present accurate information. The above is not meant to form an exhaustive guide. Neither CleanFinancial.com nor any contributing company/author accept any responsibility for any use that may be made of the above or for the correctness or accuracy of the information provided.
Advert:
Wheat Spread Betting, sponsored by FinancialSpreads.com.
You can spread bet on Wheat with Financial Spreads.
You can spread bet on Wheat with Financial Spreads.
Where Can I Trade Wheat for Free?
Trading the financial markets does involve risk. Having said that, if you want to open a Test Account, which lets you practice spread trading, then see below.When considering which investment option might work for you, don’t forget that in the UK, financial spread betting is tax free*, i.e. there is no stamp duty, capital gains tax or income tax.
If you want to try a free financial spread betting site, keep in mind that you can trade Wheat without paying any commissions through firms such as:
Free Demo Account
If you want an entirely free Demo Account / Test Account that lets users try online spread betting, and trading markets like the FTSE 100, crude oil, GBP/USD and Wheat, then you could always look into:Each of the spread betting companies listed above offer a Test Account which lets users study charts, apply a variety of orders and try out new theories.
How to Spread Bet on Wheat?
As with a variety of markets, you can place a spread bet on commodities futures, like Wheat, to go up or down.Looking at the CMC Markets platform, they are pricing the Wheat July Futures market at $626.7 – $628.0. Therefore, you can spread bet on Wheat:
 Settling above $628.0, or
 Settling below $626.7
On the closing date for this ‘July’ market, 20-Jun-12.
Whilst placing a spread bet on Wheat you trade in £x per $1.0. As a result, if you staked £4 per $1.0 and Wheat moves $29.0 then that would be a difference to your P&L of £116. £4 per $1.0 x $29.0 = £116.
Wheat Futures – Commodity Spread Trading Example
So, if we think about the above spread of $626.7 – $628.0 and assume that:- you have analysed the futures market, and
- it leads you to feel that the Wheat market will finish higher than $628.0 by 20-Jun-12
This means that you win £5 for every $1.0 that Wheat increases above $628.0. Having said that, such a bet also means that you will make a loss of £5 for every $1.0 that the Wheat market decreases below $628.0.
Looked at another way, should you buy a spread bet then your profit/loss is calculated by taking the difference between the settlement price of the market and the initial price you bought the market at. You then multiply that difference in price by the stake.
Subsequently, if, on the settlement date, Wheat settled at $653.1, then:
Profits (or losses) = (Closing Value – Opening Value) x stake
Profits (or losses) = ($653.1 – $628.0) x £5 per $1.0
Profits (or losses) = $25.1 x £5 per $1.0
Profits (or losses) = £125.50 profit
Speculating on commodity markets, by spread betting or otherwise, is not straightforward. With this example, you had bet that the commodity would rise. Naturally, the futures market could fall.
If Wheat had fallen and closed lower at $606.0, then this means you would end up making a loss.
Profits (or losses) = (Closing Value – Opening Value) x stake
Profits (or losses) = ($606.0 – $628.0) x £5 per $1.0
Profits (or losses) = -$22.0 x £5 per $1.0
Profits (or losses) = -£110.00 loss
Note: Wheat July Futures market quoted as of 26-Apr-12.
Live Wheat Chart & Prices
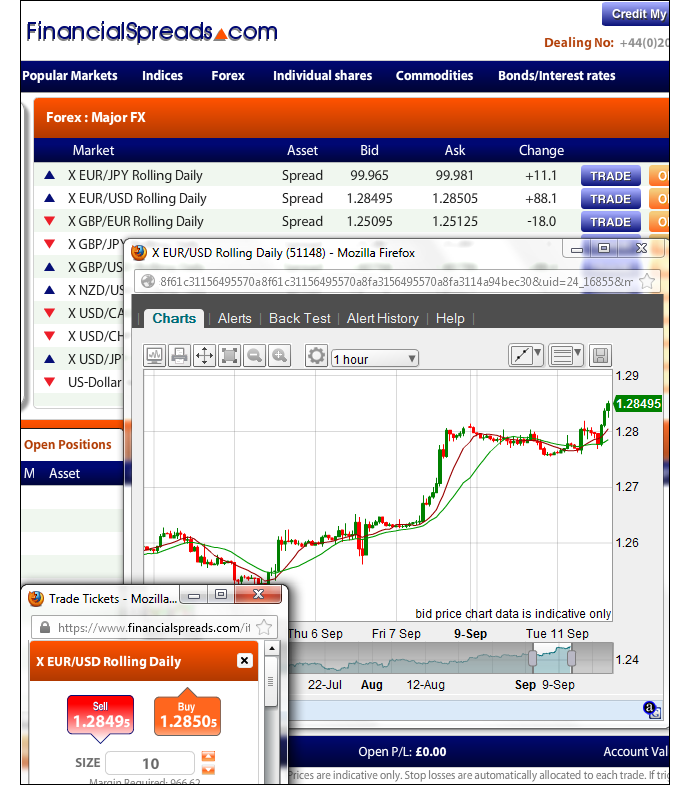
If you would like to make use of real time prices and charts for Wheat, you will generally need a spread betting account. Users should note that such accounts are normally dependent on credit, status and suitability checks.If your new account is approved, you will be able to log in and see the real-time trading prices and charts. Usually, this will be free. Having said that, you might get an occasional call or letter from the spread trading company.
Of course, if you want to spread bet then, before starting, you should note that spread trading does involve a high level of risk to your funds and it’s possible to lose more than your initial investment.
Although charting software and packages can differ from firm to firm, in order to help your trading analysis, the charts usually come with user friendly features and tools that include:
- A host of different time intervals such as 1 minute, 30 minutes, 2 hours etc.
- A variety of chart views such as candle and line charts
- Drawing features and options such as Fibonacci time zones, arcs and fans
- Indicators and overlays such as Moving Average, Momentum Percentage, Stochastic etc.
- Back Testing, Analysis and Optimisation tools
- Email alerts that trigger when a market hits a certain level
The spread betting firms in the list below offer users real-time charts and prices:
- City Index (read review)
- ETX Capital (read review)
- Financial Spreads (read review)
- Finspreads (read review)
- IG (read review)
- Inter Trader (read review)
- Spreadex (read review)
Wheat Commitments of Traders Report – 15 May 2018 (i)
Futures Only Positions, CBT , Code 1602, (Contracts of 5,000 bushels) (i)| Reporting Firms (i) | Non-Reportable Positions (i) | ||||||||
| Non-Commercial (i) |
Commercial (i) | Total Reportable (i) | |||||||
| Commitments (i) | Open (i) Interest | Commitments | |||||||
| Long (i) | Short (i) | Spreads (i) | Long | Short | Long | Short | Long | Short | |
| 165,447 | 142,803 | 103,548 | 171,910 | 183,438 | 440,905 | 429,789 | 470,717 | 29,812 | 40,928 |
| Changes from 8 May 2018 (i) | Change in (i) Open Interest | Changes from | |||||||
| Long | Short | Spreads | Long | Short | Long | Short | Long | Short | |
| -490 | 8,369 | -4,921 | 6,958 | -1,603 | 1,547 | 1,845 | 1,638 | 91 | -207 |
| Percent of Open Interest for Each Category of Trader (i) | |||||||||
| Long | Short | Spreads | Long | Short | Long | Short | Long | Short | |
| 35.1% | 30.3% | 22.0% | 36.5% | 39.0% | 93.7% | 91.3% | 6.3% | 8.7% | |
| Number of Traders in Each Category (i) | Total (i) Traders | ||||||||
| Long | Short | Spreads | Long | Short | Long | Short | |||
| 120 | 127 | 131 | 90 | 111 | 294 | 306 | 404 | ||
| Long/Short Commitments Ratios (i) | Long/Short Ratio | ||||||||
| Ratio | Ratio | Ratio | Ratio | ||||||
| 1.2:1 | 1:1.1 | 1:1 | 1:1.4 | ||||||
| Net Commitment Change (i) | |||||||||
| -8,859 | |||||||||
Also see:
Advert:
Wheat Spread Betting, sponsored by FinancialSpreads.com.
You can spread bet on Wheat with Financial Spreads.
You can spread bet on Wheat with Financial Spreads.
Soft Commodities Spread Betting Report
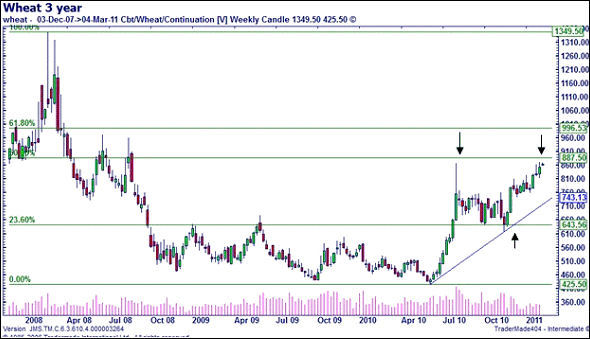
Below, analysis by Michael Hewson, Market Analyst, CMC Markets on trading soft commodities, 7-Feb-11.The rise of wheat prices after the Russian forest fires in July last year was a touch overdone in the short term.
Prices rose from June lows of $4.255 to hit peaks of $8.68 at the beginning of August. The subsequent slide back was short-lived however as a number of factors contrived to keep the price from falling back below the $6 level.
Despite the recent sharp rise in prices the wheat spread betting market is still some way short of the 2008 highs of $13.495 but it is nearing a key technical level, a break of which could well trigger further sharp rises.
The $8.875 level is 50% Fibonacci retracement level of the down move from the 2008 highs to the lows we saw last year at $4.255.
It would take a move below $7.40 trend line support from the June lows at $4.255 to undermine the current upward momentum.
The pull back from the November lows of $6.1775 can be put down to a number of factors, a lot of them weather related. However, the move by the Federal Reserve to ramp up its quantitative easing program in November marked the beginning of the move back up in prices. This was despite last week’s comments by Bernanke to the contrary that Fed policy had no discernible impact on commodity prices.
Can it be a coincidence that commodity prices bottomed out at exactly the same time as the Fed announced its $600bn asset purchase scheme?
Whatever the arguments about the catalysts for the current rise in the commodity spread betting markets, whether it be weather or the Fed’s QE, the beginning of the current rebound began in November soon after the Fed announcement.
Speculative money poured into commodities across the board, which in turn has fuelled inflationary pressures across the globe, though wheat has lagged behind corn in its rise back towards its 2008 highs.
Another factor driving the rise in prices has been the recent spate of bad weather from Argentina to Russia to Australia which has prompted concerns that supply will not be able to keep up with demand and has driven prices higher.
Egypt’s purchase of wheat over the weekend has been followed by tenders from India and Bangladesh and there is concern that this Wednesday’s USDA report will show that stocks of wheat, corn and soybeans are at their smallest in decades.
The corn spread trading market has already broken a number of key technical levels and looks set to re-test its 2008 highs of $7.79, having just broken above its 76.4% retracement level of $6.67.
This break in a highly correlated market could see wheat break above its key level at $8.875 and could well send wheat prices towards the $10.00 level, and the 61.8% retracement area at $9.9650.
For the latest update see Wheat Trading News.
Spread betting and CFD trading carry a high level of risk to your capital and you may lose more than your initial investment. Spread betting and CFD trading may not be suitable for all investors. Only speculate with money that you can afford to lose. Please ensure you fully understand the risks involved and seek independent financial advice where necessary.


