The CleanFinancial guide to Copper spread betting.
- Where Can I Spread Bet on Copper?
- Live Copper Charts
- Live Copper Prices
- Copper Trading News and Analysis
- Where Can I Trade Copper for Free?
- Where Can I Practice Trading Copper?
- How to Spread Bet on Copper?
- Commodities Spread Betting Guide
- Copper Commitments of Traders Report
Where Can I Spread Bet on Copper?
Investors are able to spread bet on Copper, in addition to an array of similar online markets, through firms such as:Note that you may also be able to speculate on Copper through other platforms.
Copper Trading Updates
5 May 2018, 12:56pm, Updated Copper COT Report
The latest Commitments of Traders Report (COT) for Copper has been released by the CFTC, see our Copper COT report below.
We have also updated our Commodities COT Summary Report.
The latest Commitments of Traders Report (COT) for Copper has been released by the CFTC, see our Copper COT report below.
We have also updated our Commodities COT Summary Report.
5 May 2018, 8:17pm, Updated Copper COT Report
The latest Commitments of Traders Report (COT) for Copper has been released by the CFTC, see our Copper COT report below.
We have also updated our Commodities COT Summary Report.
The latest Commitments of Traders Report (COT) for Copper has been released by the CFTC, see our Copper COT report below.
We have also updated our Commodities COT Summary Report.
» For more see Commodities Trading News & Analysis.
This content is for information purposes only and is not intended as a recommendation to trade. Nothing on this website should be construed as investment advice.
Unless stated otherwise, the above time is based on when we receive the data (London time). All reasonable efforts have been made to present accurate information. The above is not meant to form an exhaustive guide. Neither CleanFinancial.com nor any contributing company/author accept any responsibility for any use that may be made of the above or for the correctness or accuracy of the information provided.
Unless stated otherwise, the above time is based on when we receive the data (London time). All reasonable efforts have been made to present accurate information. The above is not meant to form an exhaustive guide. Neither CleanFinancial.com nor any contributing company/author accept any responsibility for any use that may be made of the above or for the correctness or accuracy of the information provided.
Live Copper Chart & Prices
If you’d like to analyse up-to-the-minute spread betting prices and charts for Copper, you will probably require a spread betting account. Note: Opening a spreads account is normally dependent on status and credit checks.Should your new account be approved, you will be able to log on and see the live trading prices and charts. On most platforms, these will be provided for free. The catch is that you’ll probably receive an occasional call or letter from your financial spread betting broker.
Of course, if you do decide to trade then, before starting, you should note that financial spread trading and CFD trading carry a high degree of risk to your capital and can result in losses that exceed your initial deposit.
Professional Charting Packages for Copper
Although the specific charting packages normally differ across the various providers, to help your technical analysis, the charts often come with handy tools such as:- A range of time periods, for example, 3 minutes, 15 minutes, 2 hours etc
- Various display options, for example, line, bar and candlestick charts
- Drawing options, for example, Fibonacci time zones, arcs and fans
- Chart overlays and technical indicators, for example, Exponential Moving Average, Relative Strength Index (RSI) etc
- Back Testing and Analysis tools
- Automated alerts that trigger when your chosen market reaches a specific level
The spread betting firms in the list below offer their users live trading charts/prices:
- City Index (read review)
- ETX Capital (read review)
- Financial Spreads (read review)
- Finspreads (read review)
- IG (read review)
- Inter Trader (read review)
- Spreadex (read review)
Advert:
Copper Spread Betting Guide, sponsored by FinancialSpreads.com.
You can spread bet on Copper with Financial Spreads.
You can spread bet on Copper with Financial Spreads.
Where Can I Trade Copper for Free?
Trading the financial markets is not risk free. However, if you want to open a Test Account, where you can access professional level charts and try spread trading, please see below.When looking at which trading option might work for you, also remember that in the UK, financial spread betting is tax free*, i.e. it is exempt from income tax, capital gains tax and stamp duty.
If you want to try a free financial spread betting site then note that investors can speculate on Copper without paying any commissions or brokers’ fees with providers such as:
Free Demo Account
If you want an entirely free Demo Account / Test Account that allows users to try online spread betting, and trading markets like Copper, then you can always have a closer look at:Each of the above provide a risk free Demo Account which investors can use to check charts, practice with a range of trading orders and test new ideas.
How to Spread Bet on Copper?
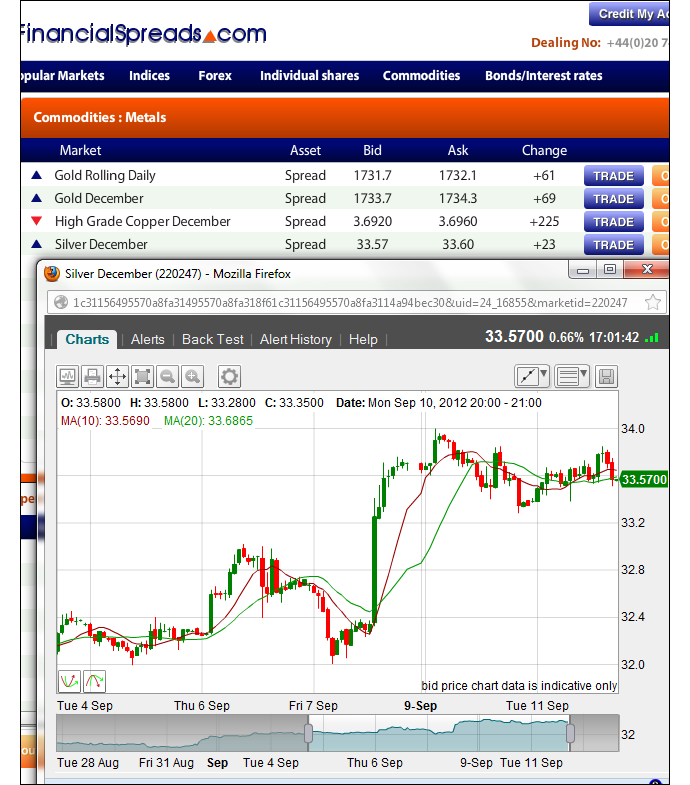
As with other metals, you can speculate on Copper to rise or fall.If you go to a spreads site like FinancialSpreads, you can see that they are pricing the Copper December Futures market at $3.7888 – $3.7928. This means that you could put a spread bet on Copper:
 Closing above $3.7928, or
 Closing below $3.7888
On the closing date for this ‘December’ market, 27-Nov-12.
When you spread bet on Copper you trade in £x per $0.0001. Therefore, if you decide to have a stake of £4 per $0.0001 and Copper moves $0.0038 then that would alter your bottom line by £152. £4 per $0.0001 x $0.0038 = £152.
Copper Futures Trading Example
Taking the above spread of $3.7888 – $3.7928, let’s assume:- You have completed your analysis of the commodities futures market, and
- You think that the Copper market will finish higher than $3.7928 by 27-Nov-12
With this trade, you make a profit of £2 for every $0.0001 that Copper rises above $3.7928. Having said that, such a trade also means that you will make a loss of £2 for every $0.0001 that the Copper market moves lower than $3.7928.
In other words, if you were to ‘Buy’ a spread bet then your profit/loss is worked out by taking the difference between the closing price of the market and the initial price you bought the spread at. You then multiply that price difference by your stake.
With that in mind, if, on the closing date, Copper settled at $3.8004, then:
Profit = (Settlement Price – Opening Price) x stake
Profit = ($3.8004 – $3.7928) x £2 per $0.0001
Profit = $0.0076 x £2 per $0.0001
Profit = £152 profit
Speculating on commodities is not easy. In this example, you had bet that the commodity would increase. However, the futures market could decrease.
If Copper decreased and closed lower at $3.7858, then you would end up making a loss and losing money on this spread bet.
Loss = (Settlement Price – Opening Price) x stake
Loss = ($3.7858 – $3.7928) x £2 per $0.0001
Loss = -$0.0070 x £2 per $0.0001
Loss = -£140 loss
Note – Copper December Futures market accurate as of 18-Sep-12.
Copper Futures Trading Example 2

On 28-Nov-07 FinancialSpreads.com were quoting the High Grade Copper (January) market at $3.0160 – $3.0240.
Therefore you could spread bet on Copper settling:
 Above $3.0240, or
 Below $3.0160
By the expiry date of 26-Dec-07.
It is important to note that with the Copper market, you trade in £X per tick, where a tick is $0.0001 of Copper price movement.
Eg if your stake was £4 per tick and the price of Copper moves $0.0005 (5 ticks) then that would be a £20 difference to your profits.
£4 per tick x 5 ticks = £20
So let’s say, taking the above spread of $3.0160 – $3.0240, that you think that the price of Copper will increase beyond the $3.0240 mark by 26-Dec-07.
Therefore you buy at $3.0240 for a stake of, let’s say, £2 per tick.
And let’s say that by the expiry date, the market closes at $3.0315.
If so, your profit and loss is found by taking the difference between the closing value, $3.0315 and the value you bought the spread bet at, $3.0240, and then multiplying that by the stake per tick.
Profits = ($3.0315 – $3.0240) x £2 per tick stake
Profits = $0.0075 x £2 per tick stake
Profits = 75 ticks x £2 per tick stake
Profits = £150 profit.
But if the market didn’t move as you originally forecast and had the price of Copper gone against your trade and the market closed at a lower than expected level of, let’s say, $3.0150, then you would have lost on this spread trade.
Loss = ($3.0150 – $3.0240) x £2 per tick stake
Loss = -$0.0090 x £2 per tick stake
Loss = -90 ticks x £2 per tick stake
Loss = -£180 loss
Note: Spread betting example price quoted: 28-Nov-07.
Advert:
Copper Spread Betting Guide, sponsored by FinancialSpreads.com.
You can spread bet on Copper with Financial Spreads.
You can spread bet on Copper with Financial Spreads.
Copper Grade #1 Commitments of Traders Report – 15 May 2018 (i)
Futures Only Positions, CMX , Code 85692, (Contracts of 25,000lbs) (i)| Reporting Firms (i) | Non-Reportable Positions (i) | ||||||||
| Non-Commercial (i) |
Commercial (i) | Total Reportable (i) | |||||||
| Commitments (i) | Open (i) Interest | Commitments | |||||||
| Long (i) | Short (i) | Spreads (i) | Long | Short | Long | Short | Long | Short | |
| 107,169 | 70,814 | 46,269 | 85,935 | 127,212 | 239,373 | 244,295 | 258,587 | 19,214 | 14,292 |
| Changes from 8 May 2018 (i) | Change in (i) Open Interest | Changes from | |||||||
| Long | Short | Spreads | Long | Short | Long | Short | Long | Short | |
| 836 | -2,067 | -2,736 | 7,226 | 9,276 | 5,326 | 4,473 | 4,753 | -573 | 280 |
| Percent of Open Interest for Each Category of Trader (i) | |||||||||
| Long | Short | Spreads | Long | Short | Long | Short | Long | Short | |
| 41.4% | 27.4% | 17.9% | 33.2% | 49.2% | 92.6% | 94.5% | 7.4% | 5.5% | |
| Number of Traders in Each Category (i) | Total (i) Traders | ||||||||
| Long | Short | Spreads | Long | Short | Long | Short | |||
| 133 | 70 | 89 | 53 | 49 | 237 | 178 | 289 | ||
| Long/Short Commitments Ratios (i) | Long/Short Ratio | ||||||||
| Ratio | Ratio | Ratio | Ratio | ||||||
| 1.5:1 | 1:1.5 | 1:1 | 1.3:1 | ||||||
| Net Commitment Change (i) | |||||||||
| 2,903 | |||||||||
Also see:
Copper Trading Report
Below, analysis by Michael Hewson, Market Analyst, CMC Markets on copper, 10-Mar-11.Over the past few months the copper prices market has been a bellwether for UK equity market gains and economic growth and has helped drive stock markets to their highest levels since mid-2008.
However despite making significant all-time highs in the past few weeks the price of the red metal has shown some signs of trend exhaustion in recent days.
Over the past 12 months concern about rising inflation in China has caused the central bank to hike bank reserve requirements eight times, and raise interest rates three times. Now we’re seeing the possibility of further tightening measures starting to get factored in.
Chinese trade data overnight, showing an unexpected deficit of $7.3bn, has certainly affected risk appetite and copper prices have dropped below their December 2010 lows around $4.20.
With rising inflation also a factor in the rest of Asia, as South Korea also raised interest rates overnight by 25 basis points to 3%, the signs are that the copper spread betting market could be due a correction.
If in fact this is the case then we could see a similar reaction in mining stocks and this could in turn drag the FTSE 100 below its recent lows at 5,860, towards the 5,800 level.
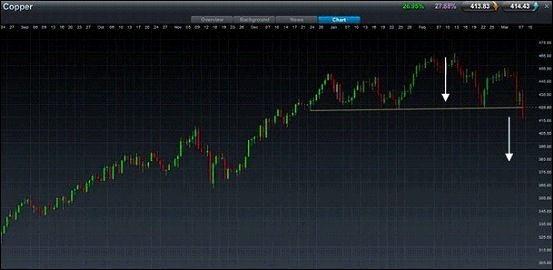
The daily copper chart appears to be in the process of completing a head and shoulders formation and yesterday we appeared to break below the neckline at $4.2580.
If the move unfolds as expected then we could expect to see a move equal to the distance from the highs at $4.6575 to the neckline at $4.20 projected downwards towards the $3.80 level over the coming weeks.
For the latest update see Copper Market Analysis and Trading News.
Spread betting and CFD trading carry a high level of risk to your capital and you may lose more than your initial investment. Spread betting and CFD trading may not be suitable for all investors. Only speculate with money that you can afford to lose. Please ensure you fully understand the risks involved and seek independent financial advice where necessary.


