You can also use a spreads account to access shorter-term daily FTSE markets. Readers should note that opening such an account is normally subject to suitability and status checks.
If your account application is accepted then, once logged in, you will be able to access the charts and the current prices. Access is normally free, however, the catch is that you could get the odd sales letter or email from your firm.
Of course, if you do decide to trade, be aware that spread trading and contracts for difference carry a high degree of risk and you may lose more than your initial deposit.
Advanced Charts for the FTSE 100
Although the charting packages normally differ from platform to platform, in order to assist you with your FTSE 100 analysis, most charts generally have:
A large range of time intervals - 1 minute, 2 minute, 10 minute, 1 hour, 4 hour, 1 month etc
A variety of chart types - candlestick, line and OHCL charts
Drawing tools and features - Fibonacci Time Zones, Arcs and Fans
The charts on Financial Spreads also offer more advanced features, including:
BackTesting, Tailored Indicators and Analysis tools
Popular overlays - Ichimoku Clouds, Parabolic SAR, EMA, Chande Kroll Stop etc
A wide selection of secondary charts - ADX, MACD, Volume Index, Historical Volatility etc
Email alerts for when your chosen market hits a pre-set level
Example FTSE 100 chart on the Financial Spreads platform
The brokers below give account holders access to real time trading charts/prices:
Stock market trading is never risk free. However, if you want to use a Practice Account, that lets you try financial spread betting, please see below for further details.
When deciding which trading option is right for you, remember that spread betting, in the UK, is exempt from income tax, stamp duty and capital gains tax*.
If you're trying to find a free spread betting platform then keep in mind that you can trade the FTSE 100 without paying brokers' fees or commissions through companies such as:
If you are interested in a free Test Account which allows users to get a better understanding of financial spread betting, and practice trading markets like the FTSE 100, then you could always take a look at:
All of the above companies provide a Demo Account that lets users practice trading, apply a variety of orders, try out strategies and review charts.
How to Spread Bet on the FTSE 100?
As with many global markets, investors can spread bet on stock market indices, like the FTSE 100, to either rise or fall.
If we log on to Financial Spreads, we can see they are showing the FTSE 100 Rolling Daily market at 5785.3 - 5786.3. This means an investor can spread bet on the FTSE 100 market:
Going above 5786.3, or Going below 5785.3
When spread betting on the FTSE 100 index you trade in £x per point.
Where a point is one point of the index itself.
Should you choose to invest £4 per point and the FTSE 100 moves 24 points then that would alter your profit/loss by £96. £4 per point x 24 points = £96.
Rolling Daily Index Markets
An important aspect of this Rolling Daily Market is that there is no closing date for your trade. You do not have to close your trade, should it still be open at the end of the day, it will roll over to the next session.
If you allow your trade to roll over and are spread betting on the market to:
Increase - then you will be charged a small overnight financing fee, or Decrease - then a small payment is normally credited to your account
Our article Rolling Daily Spread Betting goes into more detail about Rolling Daily Markets and includes a fully worked example.
FTSE 100 Trading Example 1
So, if we take the above spread of 5785.3 - 5786.3 and assume:
You have analysed the indices markets, and
You feel that the FTSE 100 index will rise above 5786.3
Then you could decide that you want to buy a spread bet at 5786.3 and risk, let's say, £2 per point.
With this trade you make a profit of £2 for every point that the FTSE 100 index moves higher than 5786.3. However, it also means that you will make a loss of £2 for every point that the FTSE 100 market moves below 5786.3.
Considering this from another angle, should you buy a spread bet then your profits (or losses) are worked out by taking the difference between the closing price of the market and the initial price you bought the market at. You then multiply that difference in price by your stake.
Therefore, if after a few trading sessions the UK stock market rose, you might want to close your position to lock in your profit.
So if the stock market increased then the spread, set by the spread betting company, might move up to 5849.4 - 5850.4. In order to close your position you would sell at 5849.4. Accordingly, with the same £2 stake:
P&L = (Closing Price - Opening Price) x stake
P&L = (5849.4 - 5786.3) x £2 per point stake
P&L = 63.1 x £2 per point stake
P&L = £126.20 profit
Speculating on stock market indices, whether by spread betting or not, doesn't always work out. In this example, you had bet that the index would go up. Nevertheless, it might go down.
If the FTSE 100 index began to drop then you might choose to close your spread bet in order to restrict your losses.
Should the market pull back to 5731.9 - 5732.9 then you would close your spread bet by selling at 5731.9. If so, you would lose:
P&L = (Closing Price - Opening Price) x stake
P&L = (5731.9 - 5786.3) x £2 per point stake
P&L = -54.4 x £2 per point stake
P&L = -£108.80 loss
Note - FTSE 100 Rolling Daily prices as of 1-Oct-12.
Below we have a simple interactive example from Financial Spreads on how spread betting works when trading the FTSE 100.
This quick example shows how the Stop Loss works and also how your upside is unlimited.
Note that Stop Losses are not guaranteed but you can opt for a Guaranteed Stop Loss with Financial Spreads.
How to Spread Bet on the UK 100 - Example 2
Looking at a spread trading website like Tradefair, we can see that they are showing the UK 100 Rolling Daily market at 5787.8 - 5788.8. This means an investor can spread bet on the UK 100 market:
Rising above 5788.8, or Falling below 5787.8
Whilst financial spread betting on the UK 100 index you trade in £x per point. So, should you decide to risk £5 per point and the UK 100 moves 27 points then that would make a difference to your bottom line of £135. £5 per point x 27 points = £135.
So, if you continue with the above spread of 5787.8 - 5788.8 and assume that:
You have done your research, and
Your research suggests that the UK 100 index will move higher than 5788.8
Then you might decide that you want to go long of the market at 5788.8 and risk, for the sake of argument, £3 per point.
So, you make a profit of £3 for every point that the UK 100 index moves above 5788.8. However, such a bet also means that you will lose £3 for every point that the UK 100 market decreases below 5788.8.
Looked at another way, if you Buy a spread bet then your profit/loss is calculated by taking the difference between the settlement price of the market and the price you bought the market at. You then multiply that difference in price by your stake.
As a result, if after a few sessions the UK stock market started to move upwards then you could choose to close your trade in order to guarantee your profit.
So if the market moved up then the spread might change to 5831.6 - 5832.6. You would close your position by selling at 5831.6. Therefore, with the same £3 stake your profit would be calculated as:
Profits (or losses) = (Closing Value - Initial Value) x stake
Profits (or losses) = (5831.6 - 5788.8) x £3 per point stake
Profits (or losses) = 42.8 x £3 per point stake
Profits (or losses) = £128.40 profit
Financial spread trading doesn't always work out as you would have liked. In this case, you wanted the UK index to rise. Nevertheless, it might decrease.
If the UK 100 index decreased, contrary to your expectations, then you might decide to close/settle your trade to limit your losses.
So if the spread fell to 5751.2 - 5752.2 you would close your trade by selling at 5751.2. Accordingly, your loss would be:
Profits (or losses) = (Closing Value - Initial Value) x stake
Profits (or losses) = (5751.2 - 5788.8) x £3 per point stake
Profits (or losses) = -37.6 x £3 per point stake
Profits (or losses) = -£112.80 loss
Note: UK 100 Rolling Daily spread betting market accurate as of 28-Nov-12.
How to Trade FTSE Futures
If we go to a platform like FinancialSpreads, you can see that they are currently pricing the FTSE 100 March Futures market at 5717.3 - 5721.3.
Therefore, you can speculate on the FTSE 100 index:
Settling above 5721.3, or Settling below 5717.3
On the expiry date for this 'March' futures market, 15-Mar-13.
As with the daily markets above, with the FTSE futures market you speculate on the FTSE 100 index in £x per point. So, if you decided to have a stake of £4 per point and the FTSE 100 moves 35 points then that would alter your profits (or losses) by £140. £4 per point x 35 points = £140.
FTSE 100 Futures Trading Example
If we think about the spread of 5717.3 - 5721.3 and assume that:
You have analysed the UK stock market, and
Your analysis suggests the UK index will finish above 5721.3 by 15-Mar-13
Then you may decide to buy the futures market at 5721.3 and risk, let's say, £5 per point.
With this contract you make a profit of £5 for every point that the FTSE 100 index rises higher than 5721.3. Nevertheless, it also means that you will make a loss of £5 for every point that the FTSE 100 market moves lower than 5721.3.
Thinking of this in a slightly different way, if you are spread trading and you 'Buy' a market then your P&L is calculated by taking the difference between the settlement price of the market and the initial price you bought the spread at. You then multiply that price difference by the stake.
As a result, if, on the expiry date, the FTSE 100 settled higher at 5749.9, then:
P&L = (Closing Price - Opening Price) x stake
P&L = (5749.9 - 5721.3) x £5 per point stake
P&L = 28.6 x £5 per point stake
P&L = £143.00 profit
Trading UK stock market futures is not always easy. With this example, you thought the index would increase. Nevertheless, the UK stock market could fall.
If the FTSE 100 fell and settled lower at 5696.4, you would end up making a loss on this trade.
P&L = (Closing Price - Opening Price) x stake
P&L = (5696.4 - 5721.3) x £5 per point stake
P&L = -24.9 x £5 per point stake
P&L = -£124.50 loss
Note - FTSE 100 March Futures market correct as of 27-Sep-12.
Financial Spread Betting on FTSE 100 Companies
Simply click on the company you're interested in spread betting on.
As well as broker ratings, indicative prices and charts, we talk you through the most popular spread betting questions for the UK firm:
Below, an old but still useful case study on the UK stock market by Shai Heffetz, InterTrader, 28-Apr-2011.
Being an index of the 100 biggest companies on the London Stock Exchange, the FTSE 100 is considered a quite reliable yardstick of the health of the economy in general.
If one looks at the period since the index started at 1000 on the 1st of January 1984, the picture certainly looks healthy. The current value of 6041 represents growth of more than 500 per cent over the 27-year term.
The fact of the matter is, however, that the index is currently well below the record level of 6950.6 it reached in December 1999, which means that in effect we have seen negative growth over the past 12 years.
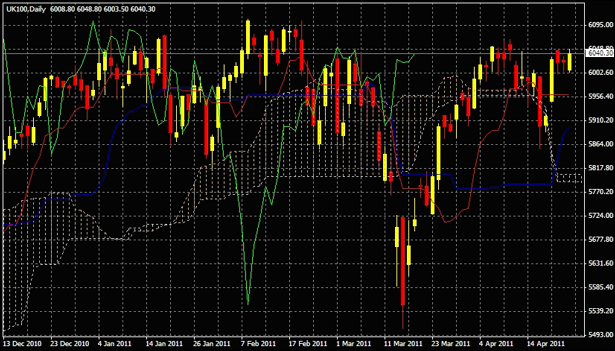
FTSE 100 Technical Analysis
If we consider technical analysis of the FTSE 100 then, looking at the Ichimoku Kinko Hyo on the candlestick chart below, everything seems to point to a bull market as the price is far above the cloud.
It is also well above the red Tenkan-Sen (short-term average) and the blue Kijun-Sen (longer-term average). The green Chinkou Span line is also well above the price 26 days ago, strengthening the perception of a bull market.
There are, however, a couple of things that could indicate that we should not jump to conclusions. The red Tenkan-Sen has turned flat, which indicates short-term uncertainty in the market, and the cloud is also very thin, which further points to indecisiveness in the market.
If the price should break through the recent high of 6064.80, we might see it test the previous high of 6106.80 it reached on 8 February. A cautious trader would not enter a medium or long-term position long position before this happens. A potential stop loss level in this case is the red Tenkan-Sen line.
In the current market, traders should wait for further signs of weakness before entering into a short position. If the price drops as far as the Ichimoku cloud, it could be on its way to test the previous low of 5505.30 on 16 March.
A careful trader will wait for the price to break downwards out of the cloud before going short, but this could rob you of most of the profits in the swing trade. An alternative, but riskier, approach would be to go short as soon as the price drops below the blue Kijun-Sen.
The London Stock Exchange (LSE) is one of the world's oldest stock exchanges. It's been trading for over 300 years. According to the LSE website it started life in the coffee houses of 17th century London (pre-Starbucks).
For readers who are not familiar with the term 'FTSE 100' it is simply an index of the 100 largest companies on the London Stock Exchange. The index is maintained and owned jointly by the Financial Times and the London Stock Exchange.
The index came into being on 1 January 1984 with a base value of 1,000. It reached a record level of 6950.6 on 30 December 1999. The financial crisis of 20072010 saw it drop dramatically to 3,500. Since then it has recovered to a large extent.
FTSE Definitions
FTSE: Financial Times Stock Exchange. These firms (FT and LSE) are jointly responsible for the compilation and maintenance of the main stock indices reflecting the performance of the UK's top shares
FTSE 100: The index of the UK's top 100 companies, as ranked by their market capitalisation. Also referred to as UK100
FTSE 250 or FTSE MID 250: The index of the next 250 FTSE companies as ranked by their market capitalisation
FTSE 350: The index of the top 350 UK companies by market capitalisation. A combination of the FTSE 100 and FTSE 250 stocks
FTSE ALL SHARE: An index covering about 800 shares representing 98% of UK stock market value
UK 100: In spread betting and CFD trading, the FTSE 100 is often called the 'UK 100'
'FTSE 100 Spread Betting' edited by Jacob Wood, updated 23-Mar-18
For related articles also see:
Stock Market Spread Betting, updated 23-Mar-18
We have stock market updates and analysis throughout the day. Our stock market guide also has live prices, charts, a spread betting comparison, tips on where to trade commission-free, tax-free* and... » read guide.
Stock Market Trading, updated 11-Jul-16
A look at popular stock market trading accounts, commission free accounts, charts, a price comparison, how to buy/sell a stock market index, regular analysis and... » read guide.
Dow Jones Spread Betting, updated 20-May-18
Dow Jones financial spread betting guide with a price comparison and daily analysis. Plus live Dow Jones charts & prices, where to spread bet on the stock market index commission-free and... » read guide.
German Stock Market Spread Betting, updated 23-Mar-18
German stock market spread betting guide with a price comparison, daily analysis, live charts & prices for the DAX 30, MDAX and German shares. Plus where to spread bet on the Frankfurt stock market commission-free and... » read guide.
S&P 500 Spread Betting, updated 20-May-18
S&P 500 financial spread betting guide with a price comparison and daily analysis. Plus live S&P 500 charts & prices, where to spread bet on the stock market index commission-free and... » read guide.
NASDAQ 100 Spread Betting, updated 23-Mar-18
Nasdaq 100 financial spread betting guide with a price comparison and daily analysis. Plus live Nasdaq 100 charts & prices, where to spread bet on the stock market index commission-free and... » read guide.
Nikkei 225 Spread Betting, updated 20-May-18
Nikkei 225 financial spread betting guide with daily analysis. Plus live Nikkei 225 charts & prices, where to spread bet on the stock market index commission-free and tax-free* as well as... » read guide.
Hang Seng Spread Betting, updated 13-Apr-17
Hang Seng financial spread betting guide with daily updates. Plus live Hang Seng charts & prices, where to spread bet on the stock market index commission-free and tax-free* as well as... » read guide.
About this page:
FTSE 100 Spread Betting
FTSE 100 financial spread betting guide with a price comparison and daily analysis. Plus live FTSE 100 charts & prices, where to spread bet on the stock market index commission-free and... » read from top.
Q) Average Trading Results?
A) Get free trading tips, offers, price updates, important news and more! All Free - Click here!