The CleanFinancial guide to Sugar spread betting.
- Where Can I Spread Bet on Sugar?
- Live Sugar Charts
- Live Sugar Prices
- Sugar Trading News and Analysis
- Where Can I Trade Sugar for Free?
- Where Can I Practice Trading Sugar?
- How to Spread Bet on Sugar?
- Commodities Spread Betting Guide
- Sugar Commitments of Traders Report
Live Sugar Chart & Prices
The live CFDs chart and prices below will provide users with a handy overview of the Sugar market.The above chart is typically based on the Sugar futures price.
To look at real time spread betting charts/prices for Sugar, you generally need a spread betting account, note that all accounts are subject to status and credit checks.
If your account application is accepted then, after logging on, you will be able to look at the real-time prices/charts. These are normally provided as part of the service.
Of course, if you want to trade then remember that CFD trading and financial spread trading involve a significant level of risk and can result in you losing more than your initial investment.
Where Can I Spread Bet on Sugar?
At the moment, you can spread bet on Sugar, and a variety of other related markets, with providers like:CleanFinancial.com readers should note that you may also be able to speculate on Sugar futures through other spread betting websites.
Sugar Futures Trading News
5 May 2018, 12:56pm, Updated Sugar No. 11 COT Report
The latest Commitments of Traders Report (COT) for Sugar No. 11 has been released by the CFTC, see our Sugar No. 11 COT report below.
We have also updated our Commodities COT Summary Report.
The latest Commitments of Traders Report (COT) for Sugar No. 11 has been released by the CFTC, see our Sugar No. 11 COT report below.
We have also updated our Commodities COT Summary Report.
5 May 2018, 8:17pm, Updated Sugar No. 11 COT Report
The latest Commitments of Traders Report (COT) for Sugar No. 11 has been released by the CFTC, see our Sugar No. 11 COT report below.
We have also updated our Commodities COT Summary Report.
The latest Commitments of Traders Report (COT) for Sugar No. 11 has been released by the CFTC, see our Sugar No. 11 COT report below.
We have also updated our Commodities COT Summary Report.
» For more see Commodities Trading News & Analysis.
This content is for information purposes only and is not intended as a recommendation to trade. Nothing on this website should be construed as investment advice.
Unless stated otherwise, the above time is based on when we receive the data (London time). All reasonable efforts have been made to present accurate information. The above is not meant to form an exhaustive guide. Neither CleanFinancial.com nor any contributing company/author accept any responsibility for any use that may be made of the above or for the correctness or accuracy of the information provided.
Unless stated otherwise, the above time is based on when we receive the data (London time). All reasonable efforts have been made to present accurate information. The above is not meant to form an exhaustive guide. Neither CleanFinancial.com nor any contributing company/author accept any responsibility for any use that may be made of the above or for the correctness or accuracy of the information provided.
Technical Charting Packages for Sugar
Whilst charts tend to differ between platforms, to help your trading, the majority of charts have user friendly tools and features that include:- A host of different intervals – 2 minutes, 15 minutes, 1 day etc
- Various display styles – candlestick charts and bar charts
- Drawing features – Trendlines and Fibonacci Retracements
- Overlays and technical indicators – Bollinger Bands, Chaikin’s Volatility, Average Directional Index etc
- BackTesting and Analysis tools
- Customised alerts when the markets reach a given price
The spread trading firms in the following list give clients access to real time charts and prices:
- City Index (read review)
- ETX Capital (read review)
- Financial Spreads (read review)
- Finspreads (read review)
- IG (read review)
- Inter Trader (read review)
- Spreadex (read review)
Advert:
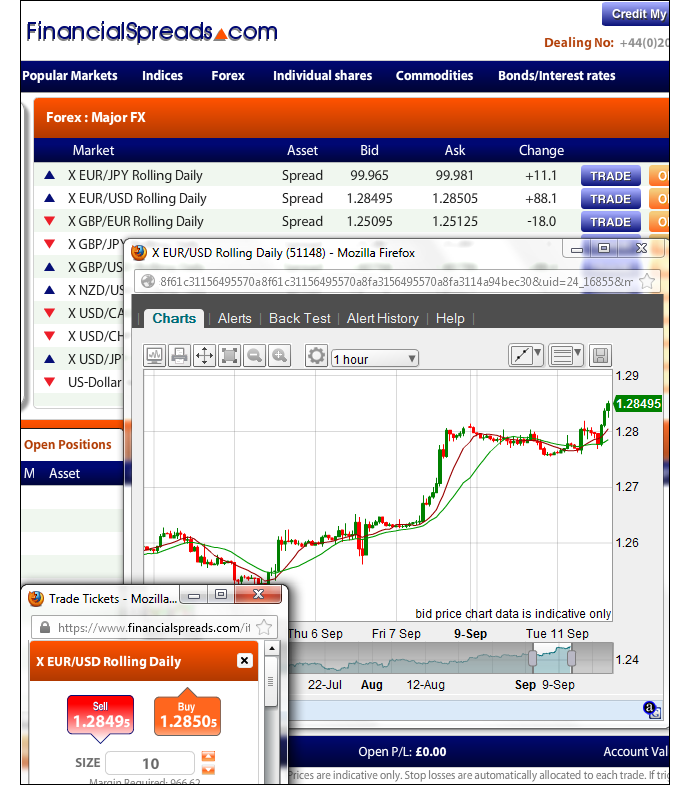
Sugar Spread Betting, sponsored by FinancialSpreads.com.
You can spread bet on Sugar with Financial Spreads.
You can spread bet on Sugar with Financial Spreads.
Where Can I Trade Sugar for Free?
Speculating always comes with an element of risk, however, if you would like to try a (free) Test Account, which lets you check candlestick charts and practice spread betting, see below.When considering which trading option is right for you, also remember that spread betting in the UK is currently tax free*, i.e. there is no capital gains tax, stamp duty or income tax.
If you’re interested in a free spread betting site then you should note that you are able to spread bet on Sugar futures with no brokers’ fees via:
Free Demo Account
If you’re looking for a free Demo Account which lets you try out spread betting on markets like the FTSE 100, gold and Sugar, then you could always consider:Each of the above offer a Test Account that allows investors to try out strategies, practice with a variety of trading orders and use charts, such as bar charts and candlestick charts.
How to Spread Bet on Sugar?
As with a range of financial markets, it is possible to place a spread bet on futures, such as Sugar, to go up or down.If you were to look at the Financial Spreads site, you would see that they are pricing the Sugar July Futures market at $21.52 – $21.58. Therefore, you can spread trade on Sugar:
 Settling above $21.58, or
 Settling below $21.52
On the expiry date for this ‘July’ market, 18-Jun-12.
When spread trading on Sugar you trade in £x per $0.01. As a result, if you invest £3 per $0.01 and Sugar moves $0.46 then there would be a difference to your bottom line of £138. £3 per $0.01 x $0.46 = £138.
Sugar Futures – Commodity Spread Trading Example
Now, if we think about the above spread of $21.52 – $21.58 and make the assumptions that:- you’ve completed your analysis of the commodities futures market, and
- it leads you to feel that the Sugar market will finish higher than $21.58 by 18-Jun-12
With such a bet you win £3 for every $0.01 that Sugar increases above $21.58. Having said that, you will make a loss of £3 for every $0.01 that the Sugar market moves below $21.58.
Looking at this from another angle, if you were to ‘Buy’ a spread bet then your profits (or losses) are calculated by taking the difference between the closing price of the market and the initial price you bought the market at. You then multiply that difference in price by the stake.
Therefore, if, on the closing date, Sugar closed at $21.90, then:
Profit / loss = (Closing Price – Opening Price) x stake
Profit / loss = ($21.90 – $21.58) x £3 per $0.01
Profit / loss = $0.32 x £3 per $0.01
Profit / loss = £96 profit
Speculating on commodities, whether by spread betting or otherwise, is not always easy. In the above example, you wanted the futures market to rise. However, the futures market could fall.
If Sugar fell, settling at $21.20, then this means you would end up making a loss.
Profit / loss = (Closing Price – Opening Price) x stake
Profit / loss = ($21.20 – $21.58) x £3 per $0.01
Profit / loss = -$0.38 x £3 per $0.01
Profit / loss = -£114 loss
Note – Sugar July Futures market accurate as of 26-Apr-12.
Advert:
Sugar Spread Betting, sponsored by FinancialSpreads.com.
You can spread bet on Sugar with Financial Spreads.
You can spread bet on Sugar with Financial Spreads.
Sugar No. 11 Commitments of Traders Report – 15 May 2018 (i)
Futures Only Positions, ICUS, Code 80732, (Contracts of 112,000lbs) (i)| Reporting Firms (i) | Non-Reportable Positions (i) | ||||||||
| Non-Commercial (i) |
Commercial (i) | Total Reportable (i) | |||||||
| Commitments (i) | Open (i) Interest | Commitments | |||||||
| Long (i) | Short (i) | Spreads (i) | Long | Short | Long | Short | Long | Short | |
| 236,742 | 325,053 | 199,625 | 511,150 | 427,445 | 947,517 | 952,123 | 1,028,716 | 81,199 | 76,593 |
| Changes from 8 May 2018 (i) | Change in (i) Open Interest | Changes from | |||||||
| Long | Short | Spreads | Long | Short | Long | Short | Long | Short | |
| 6,041 | -1,253 | 10,022 | 10,344 | 21,637 | 26,407 | 30,406 | 28,649 | 2,242 | -1,757 |
| Percent of Open Interest for Each Category of Trader (i) | |||||||||
| Long | Short | Spreads | Long | Short | Long | Short | Long | Short | |
| 23.0% | 31.6% | 19.4% | 49.7% | 41.6% | 92.1% | 92.6% | 7.9% | 7.4% | |
| Number of Traders in Each Category (i) | Total (i) Traders | ||||||||
| Long | Short | Spreads | Long | Short | Long | Short | |||
| 79 | 89 | 91 | 83 | 76 | 212 | 218 | 282 | ||
| Long/Short Commitments Ratios (i) | Long/Short Ratio | ||||||||
| Ratio | Ratio | Ratio | Ratio | ||||||
| 1:1.4 | 1.2:1 | 1:1 | 1.1:1 | ||||||
| Net Commitment Change (i) | |||||||||
| 7,294 | |||||||||
Also see:
Spread betting and CFD trading carry a high level of risk to your capital and you may lose more than your initial investment. Spread betting and CFD trading may not be suitable for all investors. Only speculate with money that you can afford to lose. Please ensure you fully understand the risks involved and seek independent financial advice where necessary.


