The CleanFinancial guide to AUD/USD spread betting.
- Where Can I Spread Bet on AUD/USD?
- Live AUD/USD Charts
- Live AUD/USD Prices
- AUD/USD Trading News and Analysis
- Where Can I Trade AUD/USD for Free?
- Where Can I Practice Trading AUD/USD?
- How to Spread Bet on AUD/USD?
- Forex Spread Betting Guide
- AUD Commitments of Traders Report
- AUD/USD Technical Analysis Case Study
Live AUD/USD Chart & Prices
The CFD trading chart below also provides you with a nice look at the AUD/USD FX pair.The Plus 500 chart above is normally based on the AUD/USD futures market (not the daily market).
If you want to look at financial spread betting charts and prices for AUD/USD, you will normally need a spread trading account.
A spreads account also lets you access the shorter term spot markets. Users should note that opening such an account is normally dependent on credit and status checks.
Should your new account be accepted then you can log on and look at the live charts and the current pricing. These are normally provided for free. So what’s the catch? You could receive an occasional call and/or letter from your online spread betting firm.
If you decide to trade then, before starting, remember that contracts for difference and spread trading do involve a high level of risk to your funds and losses could exceed your initial investment.
Where Can I Spread Bet on AUD/USD?
Currently, investors are able to take a position on AUD/USD with a number of spread betting companies:Note that you might also be able to take a position on AUD/USD with other providers.
AUD/USD Market Analysis and Trading News
5 May 2018, 12:56pm, Updated Australian Dollar COT Report
The latest Commitments of Traders Report (COT) for the Australian Dollar has been released by the CFTC, please see our Australian Dollar COT report below.
Readers should note that we have also updated our Forex COT Summary Report.
The latest Commitments of Traders Report (COT) for the Australian Dollar has been released by the CFTC, please see our Australian Dollar COT report below.
Readers should note that we have also updated our Forex COT Summary Report.
5 May 2018, 8:17pm, Updated Australian Dollar COT Report
The latest Commitments of Traders Report (COT) for the Australian Dollar has been released by the CFTC, please see our Australian Dollar COT report below.
Readers should note that we have also updated our Forex COT Summary Report.
The latest Commitments of Traders Report (COT) for the Australian Dollar has been released by the CFTC, please see our Australian Dollar COT report below.
Readers should note that we have also updated our Forex COT Summary Report.
» More forex trading views and analysis.
This content is for information purposes only and is not intended as a recommendation to trade. Nothing on this website should be construed as investment advice.
Unless stated otherwise, the above time is based on when we receive the data (London time). All reasonable efforts have been made to present accurate information. The above is not meant to form an exhaustive guide. Neither CleanFinancial.com nor any contributing company/author accept any responsibility for any use that may be made of the above or for the correctness or accuracy of the information provided.
Unless stated otherwise, the above time is based on when we receive the data (London time). All reasonable efforts have been made to present accurate information. The above is not meant to form an exhaustive guide. Neither CleanFinancial.com nor any contributing company/author accept any responsibility for any use that may be made of the above or for the correctness or accuracy of the information provided.
Professional Level Charts for AUD/USD
Despite the fact that the specific charting packages normally vary from platform to platform, to help you with your trading decisions, the charts generally have useful features that include:- A wide range of time periods such as 2 minutes, 1 hour, 1 day and so on
- Various display options such as line charts and candle charts
- Drawing options and features such as Fibonacci time zones, fans and arcs
- Technical indicators and overlays such as Bollinger Bands, Momentum, True Strength Index and so on
- BackTesting, Analysis and Optimisation functions
- Automated email alerts for when your chosen market hits a pre-determined level
The firms listed below provide their account holders with access to live trading prices and charts for a range of major and minor forex markets:
- City Index (read review)
- ETX Capital (read review)
- Financial Spreads (read review)
- Finspreads (read review)
- IG (read review)
- Inter Trader (read review)
- Spreadex (read review)
Advert:
AUD/USD Spread Betting, sponsored by FinancialSpreads.com.
You can spread bet on AUD/USD with Financial Spreads.
You can spread bet on AUD/USD with Financial Spreads.
Where Can I Trade AUD/USD for Free?
Investing in the forex markets always involves risk, however, if you’d like to try a Demo Account (free), that allows you to make use of professional level charts and try spread betting, please see below for further details.When thinking about which forex option is right for you, don’t forget that spread betting in the UK is tax free*, i.e. it is exempt from stamp duty, capital gains tax and income tax.
If you want a free spread betting site, keep in mind that you can trade AUD/USD without paying any commissions or brokers’ fees via companies like:
Free Demo Account
If you’re interested in a (free) Demo Account / Practice Account that allows you to get a feel for forex spread betting, and trading markets like AUD/USD, then have a closer look at:Each of the firms listed above provide a free Practice Account which lets users try out new theories, access charts and practice with trading orders, like guaranteed stop losses and trailing stop losses.
How to Spread Bet on AUD/USD?
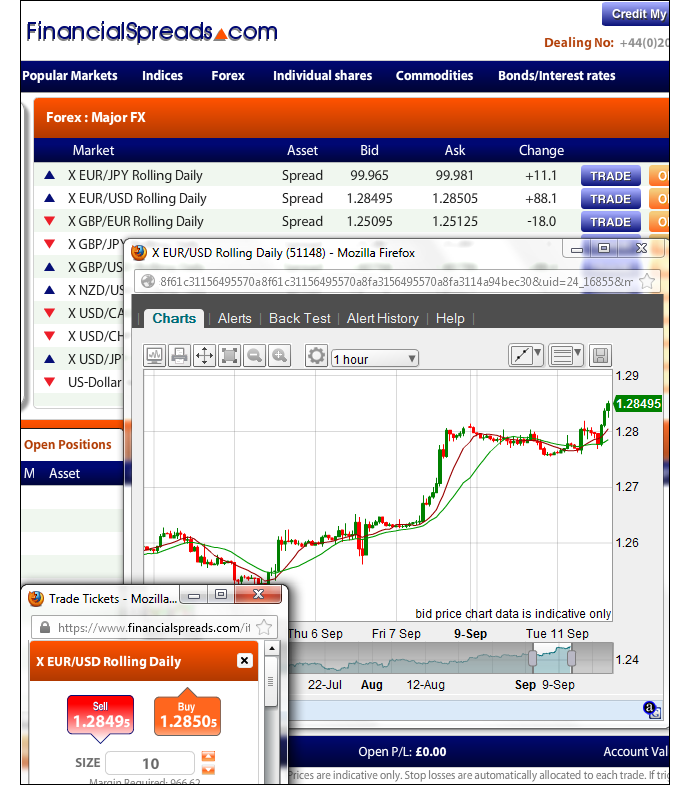
As with a wide range of markets, it is possible to spread bet on currency pairs, such as AUD/USD, to either rise or fall.If we log in to Financial Spreads, we can see they are currently offering the AUD/USD Rolling Daily market at $1.04389 – $1.04399. Therefore, an investor can spread bet on the AUD/USD rate:
 Moving higher than $1.04399, or
 Moving lower than $1.04389
When spread betting on AUD/USD you trade in £x per point where a point is $0.00010 of the pairs movement. Therefore, if you decide to risk £7 per point and AUD/USD moves 32.0 points then that would make a difference to your bottom line of £224. £7 per point x $0.00320 = £7 per point x 32.0 points = £224.
Rolling Daily FX Markets
It is important to note that this is a Rolling Daily Market and so there is no set settlement date for this market. You do not have to close your trade, should it still be open at the end of the trading day, it just rolls over into the next day.If you do roll over an FX trade then you usually pay a small overnight financing fee. For more information see Rolling Daily Spread Betting.
AUD/USD Trading Example 1
If you think about the spread of $1.04389 – $1.04399 and make the assumptions that:- you have done your market analysis, and
- it leads you to think that the AUD/USD market will rise above $1.04399
With such a bet you make a profit of £3 for every point ($0.00010) that the AUD/USD forex pair rises higher than $1.04399. Nevertheless, it also means that you will lose £3 for every point that the AUD/USD market moves lower than $1.04399.
Looking at this from another angle, if you buy a spread bet then your profit/loss is found by taking the difference between the final price of the market and the initial price you bought the market at. You then multiply that price difference by your stake.
As a result, if after a few trading sessions the FX pair rose then you might consider closing your trade so that you can lock in your profit. If that happened then the spread, set by the spread trading firm, might move up to $1.04764 – $1.04774. In order to close your spread bet you would sell at $1.04764. So, with the same £3 stake this trade would result in a profit of:
Profits (or losses) = (Closing Price – Initial Price) x stake
Profits (or losses) = ($1.04764 – $1.04399) x £3 per point stake
Profits (or losses) = $0.00365 x £3 per point stake
Profits (or losses) = 36.5 points x £3 per point stake
Profits (or losses) = £109.50 profit
Trading forex, whether by spread betting or not, can go against you. In the above example, you wanted the FX pair to rise. Naturally, the FX rate could go down.
If the AUD/USD rate dropped then you could close your spread bet to stop any further losses.
If the spread fell to $1.03981 – $1.03991 you would sell back your position at $1.03981. As a result, your loss would be:
Profits (or losses) = (Closing Price – Initial Price) x stake
Profits (or losses) = ($1.03981 – $1.04399) x £3 per point stake
Profits (or losses) = -$0.00418 x £3 per point stake
Profits (or losses) = -41.8 points x £3 per point stake
Profits (or losses) = -£125.40 loss
Note: AUD/USD Rolling Daily market taken as of 11-Sep-12.
Advert:
AUD/USD Spread Betting, sponsored by FinancialSpreads.com.
You can spread bet on AUD/USD with Financial Spreads.
You can spread bet on AUD/USD with Financial Spreads.

How to Spread Bet on Australian Dollar – US Dollar – Example 2
Looking at a spread betting website like City Index, you can see they are pricing the Australian Dollar – US Dollar Rolling Daily market at $1.04531 – $1.04541. This means that you can put a spread bet on the Australian Dollar – US Dollar pair: Moving higher than $1.04541, or
 Moving lower than $1.04531
When spread betting on Australian Dollar – US Dollar you trade in £x per point where a point is $0.00010 of the pairs movement. As a result, if you chose to risk £2 per point and Australian Dollar – US Dollar moves 39.0 points then that would alter your profits (or losses) by £78. £2 per point x $0.00390 = £2 per point x 39.0 points = £78.
Now, if we consider the above spread of $1.04531 – $1.04541 and make the assumptions that:
- You have completed your analysis of the markets, and
- It leads you to feel that the Australian Dollar – US Dollar market will rise above $1.04541
So, you make a profit of £2 for every point ($0.00010) that the Australian Dollar – US Dollar currency rate increases higher than $1.04541. Having said that, it also means that you will lose £2 for every point that the Australian Dollar – US Dollar market decreases lower than $1.04541.
Considering this from another angle, if you were to buy a spread bet then your profit/loss is calculated by taking the difference between the closing price of the market and the initial price you bought the market at. You then multiply that price difference by the stake.
If after a few sessions the FX rate started to increase then you might want to close your trade to lock in your profit.
As an example, should the market rise, the spread, determined by the spread betting company, might change to $1.05027 – $1.05037. To close your trade you would sell at $1.05027. Accordingly, with the same £2 stake this trade would result in a profit of:
Profits (or losses) = (Final Value – Initial Value) x stake
Profits (or losses) = ($1.05027 – $1.04541) x £2 per point stake
Profits (or losses) = $0.00486 x £2 per point stake
Profits (or losses) = 48.6 points x £2 per point stake
Profits (or losses) = £97.20 profit
Speculating on commodity currencies like the Aussie Dollar, by spread trading or otherwise, is never straightforward. In this example, you wanted the FX pair to go up. Nevertheless, it could decrease.
If the Australian Dollar – US Dollar rate had fallen then you could close your trade in order to limit your losses.
If the market dropped to $1.04123 – $1.04133 then you would sell back your position at $1.04123. If so, this would result in a loss of:
Profits (or losses) = (Final Value – Initial Value) x stake
Profits (or losses) = ($1.04123 – $1.04541) x £2 per point stake
Profits (or losses) = -$0.00418 x £2 per point stake
Profits (or losses) = -41.8 points x £2 per point stake
Profits (or losses) = -£83.60 loss
Note: Australian Dollar – US Dollar Rolling Daily currency market accurate as of 18-Sep-12.
Advert:
AUD/USD Spread Betting, sponsored by FinancialSpreads.com.
You can spread bet on AUD/USD with Financial Spreads.
You can spread bet on AUD/USD with Financial Spreads.
Australian Dollar Commitments of Traders Report – 15 May 2018 (i)
Futures Only Positions, CME , Code 232741, (Contracts of A$100,000) (i)| Reporting Firms (i) | Non-Reportable Positions (i) | ||||||||
| Non-Commercial (i) |
Commercial (i) | Total Reportable (i) | |||||||
| Commitments (i) | Open (i) Interest | Commitments | |||||||
| Long (i) | Short (i) | Spreads (i) | Long | Short | Long | Short | Long | Short | |
| 72,514 | 95,620 | 2,679 | 79,458 | 35,162 | 154,651 | 133,461 | 173,515 | 18,864 | 40,054 |
| Changes from 8 May 2018 (i) | Change in (i) Open Interest | Changes from | |||||||
| Long | Short | Spreads | Long | Short | Long | Short | Long | Short | |
| 9,763 | 16,103 | -970 | 7,737 | -3,051 | 16,530 | 12,082 | 13,291 | -3,239 | 1,209 |
| Percent of Open Interest for Each Category of Trader (i) | |||||||||
| Long | Short | Spreads | Long | Short | Long | Short | Long | Short | |
| 41.8% | 55.1% | 1.5% | 45.8% | 20.3% | 89.1% | 76.9% | 10.9% | 23.1% | |
| Number of Traders in Each Category (i) | Total (i) Traders | ||||||||
| Long | Short | Spreads | Long | Short | Long | Short | |||
| 20 | 39 | 15 | 17 | 20 | 44 | 67 | 89 | ||
| Long/Short Commitments Ratios (i) | Long/Short Ratio | ||||||||
| Ratio | Ratio | Ratio | Ratio | ||||||
| 1:1.3 | 2.3:1 | 1.2:1 | 1:2.1 | ||||||
| Net Commitment Change (i) | |||||||||
| -6,340 | |||||||||
Also see:
- Australian Dollar Commitments of Traders chart
- Forex COT Reports (Commitments of Traders)
- Commitments of Traders Guide
Applying Ichimoku Clouds to AUD/USD
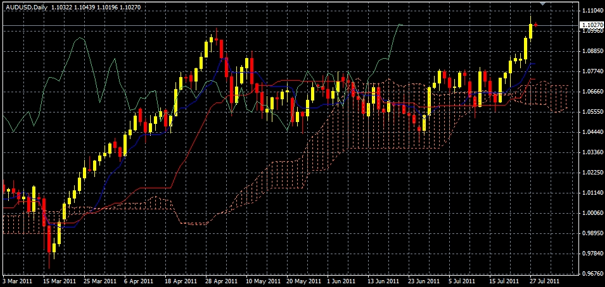
Below, a useful case study on Australian dollar/American dollar market by Shai Heffetz, InterTrader, 28-Jul-2011.If we look at the chart below, we see that AUD/USD entered a strong bull run on 21 March when it broke upwards out of the Ichimoku Kinko Hyo cloud to close at $1.00559.
After that, it went virtually straight up until it reached a maximum of $1.09592 on 29 April 2011. The next day was a down day and after that, the price started drifting downward until it entered the Ichimoku cloud on 8 June 2011.
For the next 40 days, it drifted mainly sideways until it broke out of the cloud again on 19 July. Since then we have seen a mini bull run developing.

Right now, the price is very close to the recent maximum it reached on 2 May. If it can successfully break through this psychological resistance level, we may soon see new highs.
If not, the price will most likely start drifting down towards the Ichimoku cloud again and it might even drop below the cloud, which is rather thin at the moment and will thus not provide much resistance.
The looming US debt crisis could of course have a dramatic effect on the AUD/USD rate. If the American Congress is not able to reach a consensus about raising the debt ceiling, this could seriously harm confidence in the US currency. As a result, the AUD/USD price might well soon reach new highs.
According to the Ichimoku Kinko Hyo forex analysis, we are clearly seeing a bull run. The price is above the cloud and the green Chinkou Span line is above the price 26 periods ago. In addition, both the Kijun Sen and the Tenkan Sen have also moved out of the cloud in an upwards direction.
Spread betting and CFD trading carry a high level of risk to your capital and you may lose more than your initial investment. Spread betting and CFD trading may not be suitable for all investors. Only speculate with money that you can afford to lose. Please ensure you fully understand the risks involved and seek independent financial advice where necessary.


