Spread Betting on Market Moving Events
In this article we are going to cover 3 different techniques to trade market moving financial events. They each cover a different point in time relative to a particular event.The first involves opening a trade prior to the announcement, the second considers trading the announcement itself and the third is based on the aftermath of the release.
Before going into the specifics of each technique there are few basic concepts which are common:
- The Trend is Your Friend – As a rule of thumb, I prefer a trade inline with the underline trend. One exception would be material breakdown, below the channel, in a bearish trend or a breakout, above the channel, in a bullish trend.
- High Risk Reward Ratio – As trading news carries a higher level of risk, due to high possibility of slippage and extreme volatility, it’s recommended to go into trades with a risk reward ratio greater than 3:1 or even 4:1. When you are looking to open a trade you should attempt to determine where the current support and resistance levels are to establish where your own stop loss and limit order levels should be.
Therefore, in order for the trade to enjoy a positive expectancy, one should aim that the distance of the limit order level from the current price will be 3 to 4 times bigger than the stop loss level, hence a 3:1 or 4:1 ratio. - Tight Range – Prior to the announcement it’s preferred if the market is trading in a tight range as this will confirm that traders are sitting on the sidelines, expecting the announcement.
To establish the underlying trend and momentum there are a several indicators and overlays aside from price action that may assist you in your analysis.
The first thing I like to do is to observe the prices by using a candlestick chart and following the first rule of trending; rising bottoms for a bull market and falling tops for a bear market.
The second indication I look for can be derived from the daily EMA(87); the 87 period Exponential Moving Average applied to a daily chart. When the market is bullish you can expect the price to mostly hover above it’s EMA(87) and vice versa for a bearish market.
The third indicator is used to asses the current momentum in the market. Typically I use the MACD(12,26,9) and look for positive or negative divergence without any signs of engulfing.
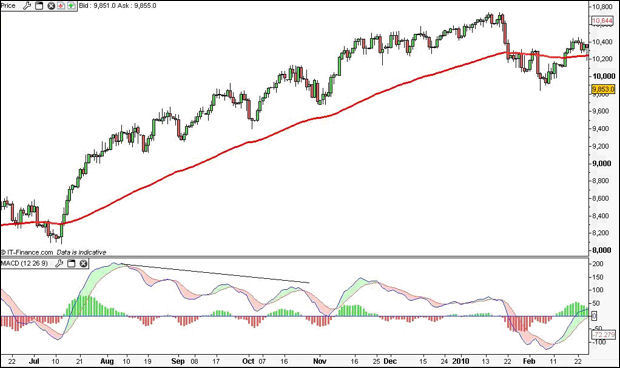
In the next example, we are going to review the underlying condition in the Dow Jones Industrial Average (DJIA) prior to the March 5th 2010 unemployment announcement in the US.

Observations:
- The Market is in a bullish trend.
- For July 2009 until January 2010, the market managed to stay above the EMA(87). In February it broke below this and only recently has it recovered back above it.
- The MACD, as our proxy for momentum, suggests that the market is recovering from its recent breakdown as the MACD is diverging positively and has recently just crossed the 0 line.
As we are considering going long we would look for the closest support as a stop loss and the next resistance line as our limit. As explained before, we should aim for the risk reward ratio to exceed 3:1.
In the chart, the Dow Jones is most recently trading around 10,400. Therefore, our profit target is 10,710 and our stop loss should be at 10,300. The profit target is 310 points from the current price whereas the stop loss is only 100 points away. As a result, our risk reward ratio is 3.1:1 which is just above our 3:1 threshold.
Now let’s get to business and discover the different ways we can trade the news.
Can You Profit?
With this strategy we will be opening a position that reflects our view of the market approximately 30-60 minutes prior to the announcement. You should identify the current trading channel and try to get a position below the pivot line if you are going long or above the pivot line if you are shorting.
Your stop loss should be placed at a point where you believe is beyond the reach of a probable market dip or spike, i.e. outside the ‘stop loss kill zone’. If there is something worse than being wrong, it’s getting it right after being stopped out.
Therefore, your stop should meet the two important qualification criteria; it must be below the stop loss kill zone while still meeting the required risk reward ratio. If you cannot meet both of these then don’t get into the trade.
Holding the Stick Both Ways
This technique is very different as you will not be taking a view on the market.
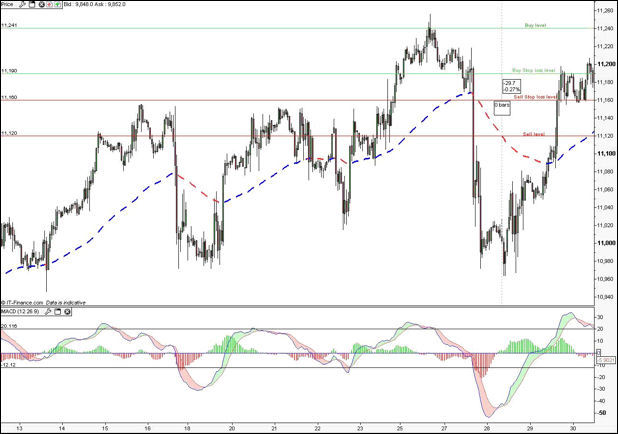
When using this method you will be placing two opposite limit-to-open orders that each have their own associated stop loss and limit orders.
You should get into this trade if you believe that there is a very high probability for this event to move the market but are not sure how it will play out.
This trade enjoys an increased probability in two circumstances. The first is when price is close the top of a bearish channel, or the bottom of a bullish channel, and the news may determine whether the current channel is completed or will be re-established.
The second occasion is if, in the days or even weeks prior to the announcement, the market is contained in a sideways movement lacking any real direction. This is a suggested step by step list:
- Identify the current range the market is trading in.
-
Decide if market conditions justify using this method. If so:
- Place a limit-to-open long order above the upper bound of the range.
- Associate a limit order at the next resistance level.
- Associate a stop loss order at around the bottom of the range.
- Place a limit-to-open short order below the lower bound of the range.
- Associate a limit order at the next support level.
- Associate a stop loss order at around the top of the range.
- Place a limit-to-open long order above the upper bound of the range.

There are a few very important golden rules when attempting this sort of opposite orders trade.
The long limit-to-open order should be above the stop loss level of the short limit-to-open short order including a safety distance in case the market slips. If possible I like to use guaranteed stops. The last thing you want is to find yourself in a fully hedged position after both your long and short orders are met but no stops are triggered.
There are two possible scenarios where you may incur a loss. Sometimes the market may decide to move one way when the announcement is released, or perhaps shortly before it, and then sharply reverses. In that case you may lose one of the positions and not benefit from the other one.
An even worse scenario is if the market becomes extremely volatile and burns your stop losses on both positions. You can minimize this risk by researching the market in terms of volatility and reviewing how the market behaved in the past when the specific announcement was released.
The risk reward analysis mentioned before remains valid, it’s just that now you must make sure it works out both ways in order to validate the positive expectancy of the specific trade.
Are You Sure This is Where You are Going?
When using this strategy you should still adhere to the basic rules of conducting pre-analysis and determining your actions beforehand.
For example, if you were trading the Dow Jones on the back of the US unemployment news release, this is one decision making process that you could choose:
- Determine the current trend in the market.
- Consider the current price in relation to the trading channel, i.e. is it a pivot, an upper boundary, or a lower boundary?
- Research the previous three releases and review:
- How the market reacted
- The accuracy of the analysts consensus
- Decide what would be your action plan. For example:
- If current consensus is that unemployment will reduce to 9.7% then
- If the actual number is 9.6% or below – LONG, Stop Loss – 10,000, Limit – 10,400.
- If the actual number is 9.9% or above – SHORT, Stop Loss – 10,200, Limit – 9,600.
- If current consensus is that unemployment will reduce to 9.7% then
At this point there are multiple scenarios. However, you only care about those which you have an action plan for and believe have a positive profit expectancy.
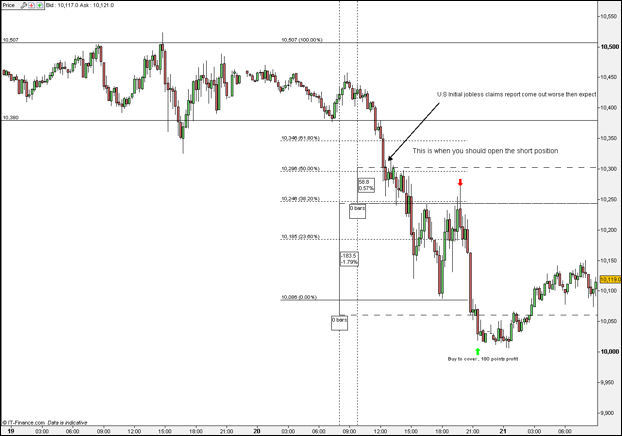
If the desired correlation between the released figures and the price action takes place then you should get ready. You should wait for the market to make its first move and retrace back. When the price retracement seems to be concluded, that’s when you open your position.
At this point in time the market has made its first move and confirmed the new direction and so the profit expectancy of this trade has dramatically increased.
Below you can find an example based on the May 20th weekly unemployment report. Consensus expectations were for -446k when the market is trending down. The plan is that if the figure proves to be worse then expected it may fuel further selling and, therefore, short is the way to go. See chart below:

Summary
In this article we reviewed three different ways of spread trading on financial news.
We started with an option where you take a stand prior to the release; this trade carries significant risk and yet offers the highest reward within a short time span.
The second one is unique in nature as you do not take a stand initially but you operate under the assumption that a range breakout will enjoy a continuation.
The third method encourages you to trade a trend continuation after an initial corrective move in the market. The most evident downside to this method is that you might miss out on the first big movement in the market. In this case, the retracement you are waiting for may never occur, or may take place at a much lower level where the risk reward ratio does not justify a trade.
It’s important to remember that, regardless of the strategy you employ, to research, plan and execute a trade only if the underline conditions match your plan. Do not be tempted to trade just because you prepared for it and are looking for action.
Spread betting and CFD trading carry a high level of risk to your capital and you may lose more than your initial investment. Spread betting and CFD trading may not be suitable for all investors. Only speculate with money that you can afford to lose. Please ensure you fully understand the risks involved and seek independent financial advice where necessary.
