A more technical look at the markets from InterTrader
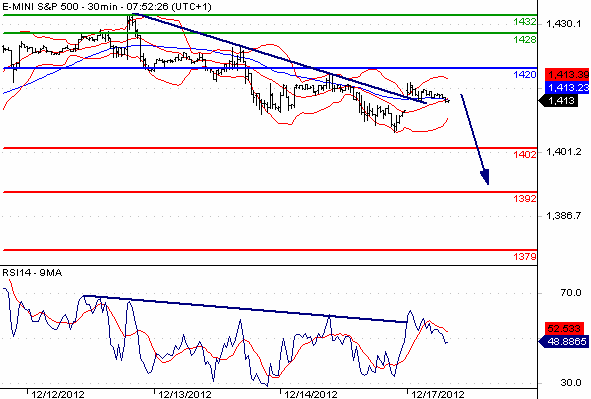
The S&P 500 attempted to rally on Friday with the bulls falling again at the 1420 level.
The shooting star that was formed on the daily chart suggests a bearish outlook for the market.
At 1418 this morning, it looks like the bears have the upper hand. With the fiscal cliff talks in the US being the main headline risk, we expect the market to go lower.
The negative trend line capping the Relative Strength Index (RSI) is a further indication of the downside potential in the market.

S&P 500 Candlestick Chart
As long as resistance at 1420 remains intact, we are likely to see choppy price action with a bearish bias potentially dragging the stock market index all the way down to 1400.
A break below that level would expose the 1392 and 1379 areas. Alternatively, the upside breakout of 1420 could open the way to 1428 and 1432.
In terms of economic data, today we have US Empire State Mfg Survey and US Treasury International Capital.
Good luck
Dafni Sedari
(Original article written 17 December 2012).
Spread betting and CFD trading carry a high level of risk to your capital and you may lose more than your initial investment. Spread betting and CFD trading may not be suitable for all investors. Only speculate with money that you can afford to lose. Please ensure you fully understand the risks involved and seek independent financial advice where necessary.
