Trading the USD/CHF FX Pair
Like many investors I always try to increase the probability of each and every trade becoming profitable.
One such way is to use multiple timeframes when you are considering entering into a position. Here I am going to discuss the way in which I use this method for intraday trading and will use the USD/CHF pair as an example.
It is important to note that, even though I will usually stay in the market for no more then 6-12 hours, I am still using charts from a completely different scale to support my decision.
For my investments I generally use 3 different timeframes before making any decision.
- Daily chart over 24 months
- Hourly chart over 3 months
- 15 minute chart over 7 days
Daily Chart
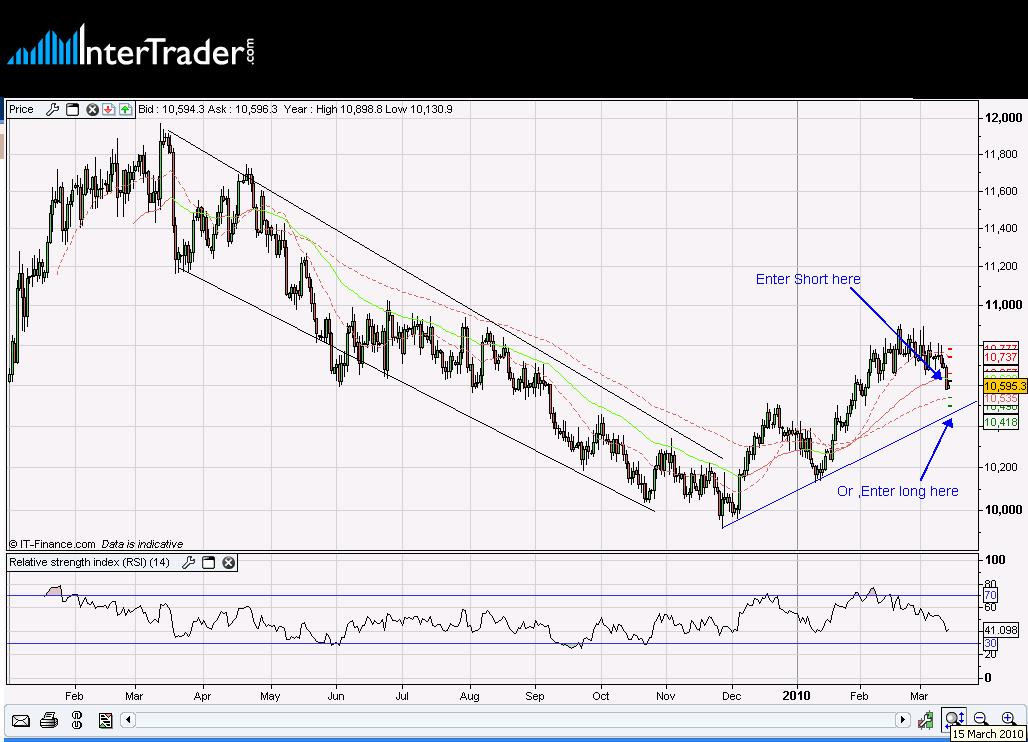
The daily chart will be used in order to understand the underlying trend of the overall market.
According to my analysis of the USD/CHF market, we are currently in a downturn towards the lower boundary of a bullish run. This implies two potential and opposite trades.
- Long – assuming that I am correct about the trend there is a high probability that price will rebound once it touches the lower bound of the trading channel.
- Short – The argument is the same but, why wait? We can go short now and exit when the price hits the lower bound.

Hourly Chart
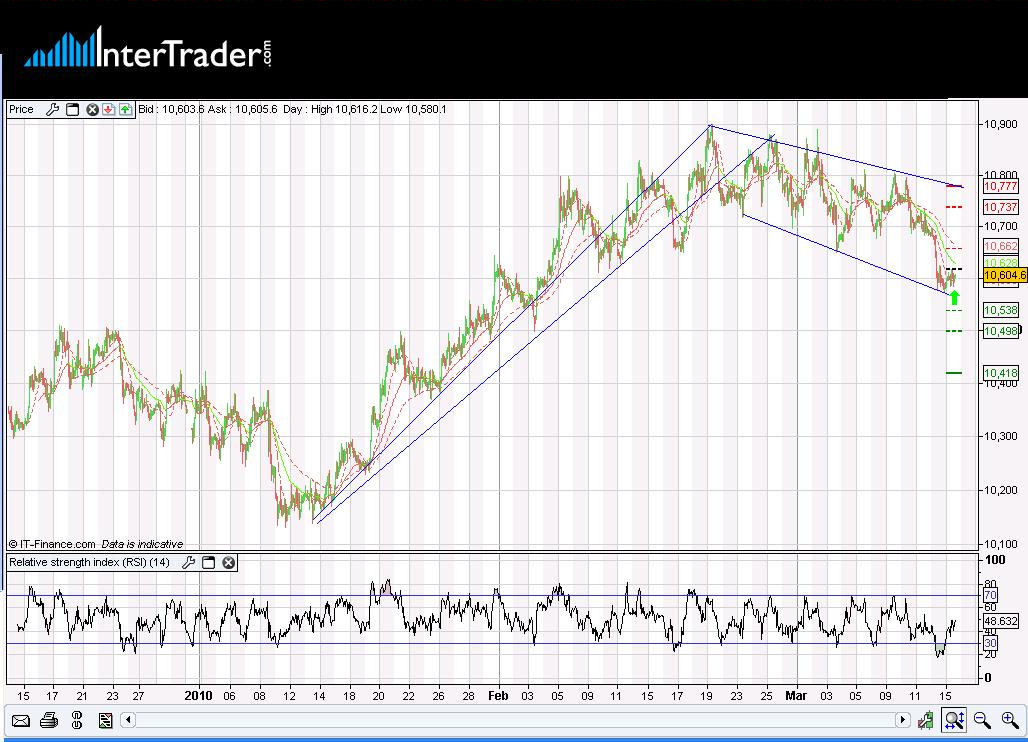
The hourly chart tells a different story. From the beginning of January 2010 to the 19th of February the market was in a bullish trend, a 45 degree positive incline. From February you can see the trend has run out of steam.

The rising bottoms are gone and have been replaced by falling tops, this suggests that the bullish run is over and we are now in the midst of a bear move.
This is enough information for me to make a decision about which way to make my trade. I will take the downside, short on the US Dollar.
My target would be the bottom of the channel on the daily trend and my stop loss will be placed around what I see as the closest resistance point, in this case SFr 1.0737.
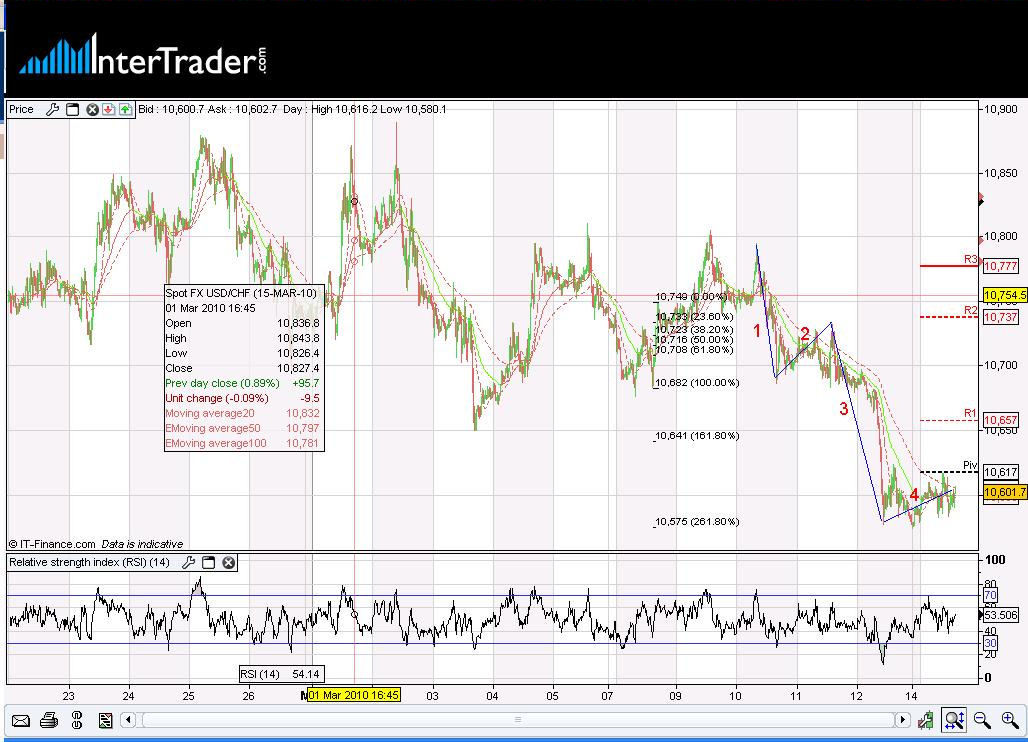
In order to fully optimise the potential of the trade I will narrow down to the 15 minutes chart. This chart will not affect the decision to go long or short in any way, it will only determine where the optimal entry point is.
15 Minute Chart
For this I will be referring to the Elliot wave principle. By assuming that the main movement is downwards we can presume that we are now in wave 4 of the movement.
Therefore, all we need now is the beginning of a downturn, indicating the commencement of wave #5, in order to get into the position. See chart below.

Review
To summarise, we used the daily chart to understand the overall market direction and the type of the trend, i.e. direction, uniformity, stage.
The hourly chart was used to determine the direction of the trade itself and the 15 min chart was finally used to locate the optimal entry point.
Spread betting and CFD trading carry a high level of risk to your capital and you may lose more than your initial investment. Spread betting and CFD trading may not be suitable for all investors. Only speculate with money that you can afford to lose. Please ensure you fully understand the risks involved and seek independent financial advice where necessary.
