A more technical look at the markets from InterTrader
The GBP/USD kick started the week on positive footing with the bulls pushing the market above the highs from Friday’s shooting star.
As the BoE sees inflation holding above the 2% target over the next two years, it looks like the central bank is moving away from its easing cycle, reinforcing the bullish outlook for sterling.
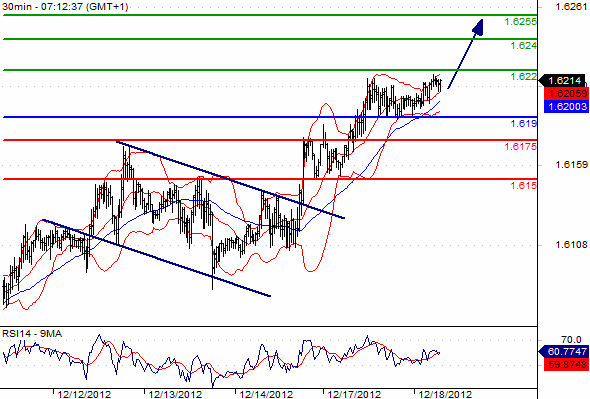
At $1.6205, at the time of writing, it looks like the bulls continue to be in full control and we could see the market testing September’s highs at $1.6268 soon.
We do expect some choppy price action on the way up, but as long as support at $1.6022 remains intact, there seems to be no reason for the bulls to worry.

GBP/USD Chart
On the daily trading chart, the market currently looks like it is breaking out and the upside penetration of $1.6268 could open the door to the $1.70 area.
Any movement to the downside could be seen as a buying opportunity for FX spread betting investors as long as the market remains well supported above $1.6022.
The main topic for today will be November’s UK Consumer Price Index report at 09.30 (GMT).
Good luck
Dafni Sedari
(Original article written 18 December 2012).
Spread betting and CFD trading carry a high level of risk to your capital and you may lose more than your initial investment. Spread betting and CFD trading may not be suitable for all investors. Only speculate with money that you can afford to lose. Please ensure you fully understand the risks involved and seek independent financial advice where necessary.
