A more technical look at the markets from InterTrader
After falling hard on Wednesday and breaking the recently formatted support at 5700, the FTSE 100 remains on a cautious footing this morning.
At the time of writing, the market is just in the green at 5678, as it seems to be finding the 5654/67 area a bit of a struggle for now.
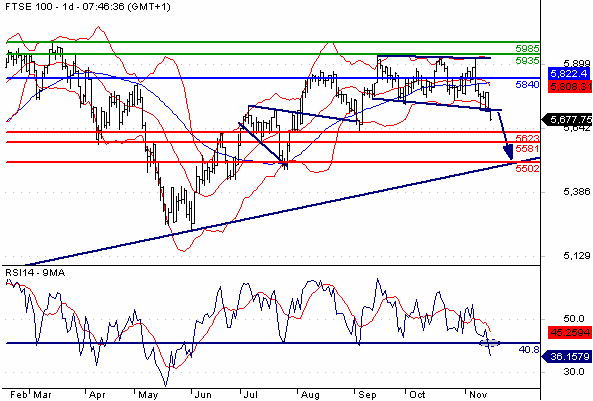
With the technical indicators reversing downwards on the daily chart (below), the index spread betting market looks set to move into consolidation before further downside comes.

FTSE 100 Technical Analysis Chart
As long as resistance at 5840 remains in place, any rally that shows weakness could be seen as a selling opportunity.
A downward penetration of the 5581 level would validate the bearish scenario and expose the key support area at 5502. Only a break through the 5840 resistance could delay the bearish scenario.
On the economic data front things are a little quiet with the EMU Merchandise Trend due for release this morning and the US Industrial Production later in the evening.
Good luck and happy trading
Dafni Sedari, InterTrader
(Original article written 16 November 2012).
Spread betting and CFD trading carry a high level of risk to your capital and you may lose more than your initial investment. Spread betting and CFD trading may not be suitable for all investors. Only speculate with money that you can afford to lose. Please ensure you fully understand the risks involved and seek independent financial advice where necessary.
