In this discussion we will delve a little deeper into the secrets of Elliott Wave analysis.
For a brief introduction to Elliott Wave theory also see our feature, Spread Betting and Elliott Waves.
Elliott Wave Trading Analysis: Motive Waves
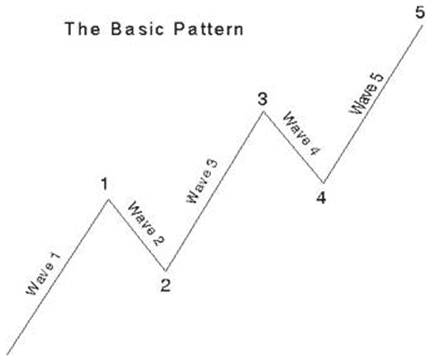
As a reference, the chart below shows the basic Elliott Wave pattern.‘Motive waves’ can be subdivided into five waves with recognisable characteristics.
They always move in the same direction of the main trend, which, for financial spread betting markets, can of course be up or down. Generally, they are not difficult to recognise or interpret. In the chart below, waves 1 to 5 are such a set of motive waves in a bull market.
Within such a set of motive waves, wave 2 will never retrace more than 100% of the first wave, i.e. the end of wave 2 will not drop below the start of wave 1 in a bull market.
Wave 4 will also not retrace more than 100% of wave 3. What is more, wave 3 will always end higher than wave 1 in a bull market and lower than wave 1 in a bear market.
Elliott further postulated that, in price terms:
a) Wave 3 is, for a large percentage of cases, the longest wave
b) Wave 3 will never be the shortest of the three ‘actionary’ waves (1, 3 and 5)
This rule holds as long the size of wave 3’s movement is larger than that of wave 1 and 5 in percentage terms.
Elliott also identified two types of motives waves, ‘impulse waves’ and ‘diagonal triangles’.

Elliott Wave Trading Analysis: Impulse Waves
Impulse waves are the most common type of motive waves. In an impulse wave, wave number 4 will never overlap with wave 1.We can clearly see this in the basic Elliott Wave chart above, where the bottom of wave 4 is above the top of wave 1.
According to Elliott, this will be true for all ‘cash’ markets, i.e. non-leveraged markets. In markets with large leverage, such as FTSE futures, there might sometimes be short-term extremes that one would not normally see in a cash market.
Even in these markets, suggests Elliott, overlapping is extremely rare and normally only happens in intraday price fluctuations.
Elliott and his team of researchers were very sure of their findings in this regard. In fact they said that in years of practice with a large number of wave patterns they found only a single instance where it could be suggested that these rules were broken.
Analysts who break these rules on a regular basis are thus not following Elliott Wave analysis, but some other form of spread betting analysis.
Elliott Wave Trading Analysis: Diagonal Triangles
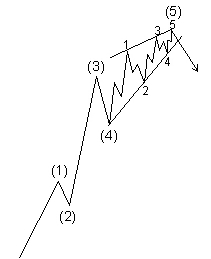
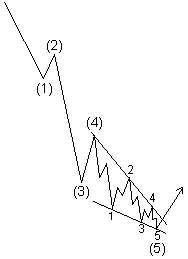
At certain locations in the wave structure, impulse wave patterns are sometimes substituted by diagonal triangles.In the two charts below, we can see that what would normally have been wave 5 has been replaced by a diagonal triangle, itself consisting of five sub-waves.
A diagonal triangle is thus not the ordinary old impulse wave we have seen in the basic pattern above, yet it is still a motive pattern since it moves in the same direction as the main trend.
A diagonal triangle has one or two corrective characteristics. As is the case with impulses, no corrective sub-wave will fully retrace the progress of the actionary sub-wave that preceded it.
A diagonal triangle, however, is the only five-wave structure in the direction of the trend where wave 4 virtually always dips into the territory of wave 1.
We can see both rules in action in the first chart below. In the triangle, wave 2 does not fully retrace wave 1, but wave 4 ends below the top of wave 1. It sometimes, but extremely rarely, happens that a diagonal triangle ends in a truncation.

|

|
Elliott Wave Trading Analysis: Ending Diagonals
An ending diagonal is a particular kind of diagonal triangle, which happens only in the fifth wave position at times when the market has moved ‘too far too fast’, according to Elliott.Ending diagonals can be clearly distinguished by their wedge shape within two lines that are converging. Each sub-wave, e.g. waves 1, 3 and 5 are, in turn, subdivided into three sub-waves.
Both of the diagonal wave charts above are examples of ending diagonals.
Elliott Wave Trading Analysis: Extensions
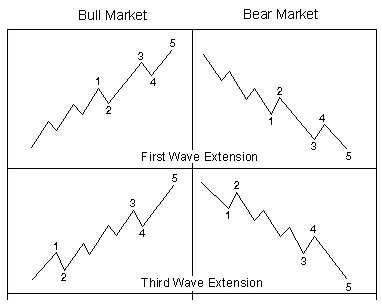
Most impulse wave sets contain what Elliott refers to as ‘extensions’, which are actually extended impulse waves with amplified subdivisions.The overwhelming majority of impulse waves contain no more than one extension, which occurs in one of the three actionary sub-waves, i.e. the sub-waves going in the direction of the main trend.
In the final set of charts below we see four examples of this in sub-waves 1 and 3 on the uptrend and sub-waves 1 and 2 on the downtrend.
Extension waves can sometimes be virtually the same size as the main impulse waves. In the charts below this results in a wave pattern with nine sub-waves rather than the usual five.

Spread Trading Analysis
For more articles looking at spread trading analysis see:- Introduction to Elliott Waves
- Combining Elliott Waves and Stochastics
- Elliott Wave Advanced Trading Analysis
- Combining Technical and Fundamental Analysis
- Managing Positions
- Channel Trading
- Guide to Using Ichimoku Clouds
Good luck and happy trading
Shai Heffetz, InterTrader
(Original article written 16 February 2012).
Spread betting and CFD trading carry a high level of risk to your capital and you may lose more than your initial investment. Spread betting and CFD trading may not be suitable for all investors. Only speculate with money that you can afford to lose. Please ensure you fully understand the risks involved and seek independent financial advice where necessary.
