
A quick guide to the US Dollar Index.
- US Dollar Index Analysis
- Getting Live Prices & Charts for the US Dollar Index
- What is the US Dollar Index?
- US Dollar Index Commitments of Traders Report
- How to Find the US Dollar Index
- Dow Jones FXCM Dollar Index Basket
- Where Will The US Dollar Head Next?
- US Dollar Index Technical Analysis Case Study
Live US Dollar Index Chart & Prices
The CFD trading chart and prices below will give readers a helpful guide to USD/RUB.Getting Live Prices & Charts for the US Dollar Index
As well as live prices and charts, you can spread bet on the US Dollar Index with the following firms:- City Index Review
- CMC Markets Review
- ETX Capital Review
- Financial Spreads Review
- Finspreads Review
- IG Index Review
- InterTrader Review
- Spreadex Review
- Tradefair Review
Readers should note that spread betting, CFDs and margined FX are leveraged products and carry a high level of risk to one’s capital. It is possible to lose more than your initial investment.
These products may not be suitable for all investors, therefore ensure you understand the risks involved and seek independent advice if necessary.
USD Index Trading News
5 May 2018, 12:56pm, Updated US Dollar Index COT Report
The latest Commitments of Traders Report (COT) for the US Dollar Index has been released by the CFTC, please see our US Dollar Index COT report below.
Readers should note that we have also updated our Forex COT Summary Report.
The latest Commitments of Traders Report (COT) for the US Dollar Index has been released by the CFTC, please see our US Dollar Index COT report below.
Readers should note that we have also updated our Forex COT Summary Report.
Update by Gordon Childs, Editor, 
5 May 2018, 8:17pm, Updated US Dollar Index COT Report
The latest Commitments of Traders Report (COT) for the US Dollar Index has been released by the CFTC, please see our US Dollar Index COT report below.
Readers should note that we have also updated our Forex COT Summary Report.
The latest Commitments of Traders Report (COT) for the US Dollar Index has been released by the CFTC, please see our US Dollar Index COT report below.
Readers should note that we have also updated our Forex COT Summary Report.
Update by Gordon Childs, Editor,
» For more see Forex Trading News & Analysis.
This content is for information purposes only and is not intended as a recommendation to trade. Nothing on this website should be construed as investment advice.
Unless stated otherwise, the above time is based on when we receive the data (London time). All reasonable efforts have been made to present accurate information. The above is not meant to form an exhaustive guide. Neither CleanFinancial.com nor any contributing company/author accept any responsibility for any use that may be made of the above or for the correctness or accuracy of the information provided.
Unless stated otherwise, the above time is based on when we receive the data (London time). All reasonable efforts have been made to present accurate information. The above is not meant to form an exhaustive guide. Neither CleanFinancial.com nor any contributing company/author accept any responsibility for any use that may be made of the above or for the correctness or accuracy of the information provided.
What is the US Dollar Index?
The USD index is a valuation of the dollar against a specific set (basket) of currencies.As a result, the US Dollar Index gives a good indication of the standing of the dollar in the world economy.
The currencies included in the index are:
- The Euro, with a weighting of 58.6%.
- The Japanese Yen, with a weighting of 12.6%.
- The British Pound, with a weighting of 11.9%.
- The Canadian Dollar, with a weighting of 9.1%.
- The Swedish Krona, with a weighting of 4.2%.
- The Swiss Franc, with a weighting of 3.6%.
How to Find the US Dollar Index
A lot of spread betting platforms like to hide this market.I think it should go in with the forex markets but most platforms tend to put the index in the (stock market) indices sections. E.g. Financial Spreads currently have it in their American Indices section:

US Dollar Index Commitments of Traders Report – 15 May 2018 (i)
Futures Only Positions, ICUS, Code 98662, (US Dollar Index x $1000) (i)| Reporting Firms (i) | Non-Reportable Positions (i) | ||||||||
| Non-Commercial (i) |
Commercial (i) | Total Reportable (i) | |||||||
| Commitments (i) | Open (i) Interest | Commitments | |||||||
| Long (i) | Short (i) | Spreads (i) | Long | Short | Long | Short | Long | Short | |
| 28,694 | 28,676 | 1,964 | 2,944 | 7,629 | 33,602 | 38,269 | 40,239 | 6,637 | 1,970 |
| Changes from 8 May 2018 (i) | Change in (i) Open Interest | Changes from | |||||||
| Long | Short | Spreads | Long | Short | Long | Short | Long | Short | |
| 2,636 | 2,069 | 77 | 116 | 816 | 2,829 | 2,962 | 2,915 | 86 | -47 |
| Percent of Open Interest for Each Category of Trader (i) | |||||||||
| Long | Short | Spreads | Long | Short | Long | Short | Long | Short | |
| 71.3% | 71.3% | 4.9% | 7.3% | 19.0% | 83.5% | 95.1% | 16.5% | 4.9% | |
| Number of Traders in Each Category (i) | Total (i) Traders | ||||||||
| Long | Short | Spreads | Long | Short | Long | Short | |||
| 91 | 36 | 14 | 9 | 6 | 110 | 47 | 140 | ||
| Long/Short Commitments Ratios (i) | Long/Short Ratio | ||||||||
| Ratio | Ratio | Ratio | Ratio | ||||||
| 1:1 | 1:2.6 | 1:1.1 | 3.4:1 | ||||||
| Net Commitment Change (i) | |||||||||
| 567 | |||||||||
Also see:
Dow Jones FXCM Dollar Index Basket
The as well as the typical US Dollar index described above there are other types of Dollar index.In August 2011, FXCM worked with ‘Dow Jones Indexes’ to create the ‘Dow Jones FXCM Dollar Index’.
The Dow Jones FXCM Dollar Index compares the US dollar to four of the world’s most liquid currencies: the euro, the pound, Australian dollar and the Japanese yen.
Commenting on the new index, Drew Niv, CEO of FXCM, said, “The Dow Jones FXCM Dollar Index was designed…to avoid outdated currency pair selection and esoteric methodology, using the most relevant currencies and straightforward design.
Not surprisingly, you can trade this market with FXCM but we have not yet seen it offered on other platforms.
October Seasonals vs The US Dollar Index
Below, a seasonal trading update by Ashraf Laidi, Chief Global Strategist at City Index, 9 Oct 2013.Over the last 10 years, October has been the worst performing month for the US dollar index, 2008 and 2005 are the only exceptions to this.
October 2008 was the great deleveraging and October 2005 culminated with large USD repatriation flows resulting from the Bush Home Investment Act.
You have been warned.
Where Will The US Dollar Head Next?
Below, an interesting article by Ashraf Laidi, Chief Global Strategist at City Index, 9 Aug 2013.Four weeks ago, the USD index hit 3-year highs, metals licked their wounds from the biggest decline in decades and the US growth story stood out in the headline.
The Fed was considered the only major central bank capable of scaling down its quantitative easing, while the ECB mulled cutting interest rates to zero.
The greenback was boosted by a powerful combination of fundamental and technical moving in tandem.
But all changed in June when the Fed reminded that any tapering of asset purchases would not necessarily tighten monetary policy as persistent growth in the Fed’s balance sheet would help maintain liquidity driven in the markets.
The Fed’s statement was not isolated.
Signs of stabilization in the business surveys of the Eurozone and the UK PMIs as well as market scepticism with Japan PM Abe’s “policy arrows” conspired to rebalance the flows in currency markets.
The timing of the aforementioned dynamics is never a coincidence.
From a charts perspective, the greenback had tested an 8-year trendline resistance (see chart), EURUSD tested a 12-month trendline support and the yield on the US 10-year government note tested its 6-year trendline.
What Markets to Watch?
The list of explanations can go further and so do the plausible scenarios for a continuation of the USD’s downtrend as well as its recovery.
As it stands, we expect further strength in both the yen and sterling against the USD into the rest of the month until the USD index retests its 2-year trend support at 80.40-45.
This implies an equivalent resistance near $1.3450s and $1.5660s in EURUSD and GBPUSD respectively.
What Should Investors Look Out For?
Once these currency parameters are attained, the commentary from the Fed will once again be scrutinized as we near the revision of US Q2 GDP, the release of the August jobs report and the Fed’s annual symposium in Jackson Hole, all taking place in the final week of August/early September.
The fundamental scenarios for a break in USD support could well include a lower than expected tapering of the $85bn in asset purchases, or no tapering at all in September but only a mild announcement for December.
And do not discount the role of the obligatory article from Wall Street Journal’s Fed watcher Jon Hilsenrath, whose effectiveness in steering bond and FX markets has returned after a temporary lull late last year.
On the fiscal side, FX traders will closely watch President Obama’s corporate tax reforms and the possibility of slashing taxes on US multinationals’ foreign earnings.
When Bush introduced similar reform in 2004 as part of the Homeland Investment Act, the dollar had a powerful year resulting from US multinationals repatriating nearly $0.5bn to qualify for the tax holiday in 2005.
We have not covered non-US factors, which could stem the tide of USD-negative FX flows such as:
- Negative surprises from China’s macro data/money markets;
- Rising pre-election tensions in the camp of German Chancellor Merkel
- Unforeseen finance shortfalls from the sovereign obligations of Southern Eurozone nations
Long Term USD Index Chart:

US Dollar Index Technical Analysis
Below, an older but interesting case study where Shai Heffetz of InterTrader has applied technical analysis theory to the USD index, 20 Oct 2011.If we look at the chart below, we can see that for the best part of August, the Index moved mainly sideways, staying in a narrow band between 73.5 and 75.5.
On the 5th of September, it moved above the Ichimoku Kinko Hyo cloud for the first time in quite a while, closing at 75.16. The next day saw the beginning of a relatively strong bull run that lasted for the majority of September.
On the 4th of October, the price briefly touched 79.84 before starting to drop, closing at 78.96. Since then it has dropped below the red Tenkan Sen line and also below the blue Kijun Sen.
Right now, it is still safely above the Ichimoku cloud, but on the 19th of October, we saw the price briefly touch the cloud at 75.83, the lowest point it has reached in more than a month.
Technical analysis suggests that if the price closes in the Ichimoku cloud soon, it will officially be the end of the bull run. Should it then emerge from the cloud in a downwards direction, short traders might start to look for an entry point.
Right now, the price will have to increase significantly, rising above the level it reached on the 4th of October, to consider a long trade.

Possible Sentiment Change for the US Dollar
Below, another older article but it takes an interesting look at how dollar sentiment can change. Analysis by Michael Hewson, Market Analyst, CMC Markets, 12 October 2010.The recent comments by new Fed vice chairman Janet Yellen, while really stating the obvious as far as markets are concerned with respect to loose monetary policy, has given some US Dollar sellers pause for thought.
Combined with China’s move to tighten its reserve requirements on its six major banks to 17%, this has led some market participants to feel it’s prudent to take some money out of the forex spread trading markets. The Euro in particular has backed away from its $1.4020 potential double top highs.
Some discomfort about the high level of the Euro from some European Central bank officials may also have helped in that respect, as peripheral Eurozone countries continue to wrestle with high debt loads, a banking crisis and fiscal austerity.
As such this current Euro rally will not be doing them any favours whatsoever as they look to try and generate growth in their economies.
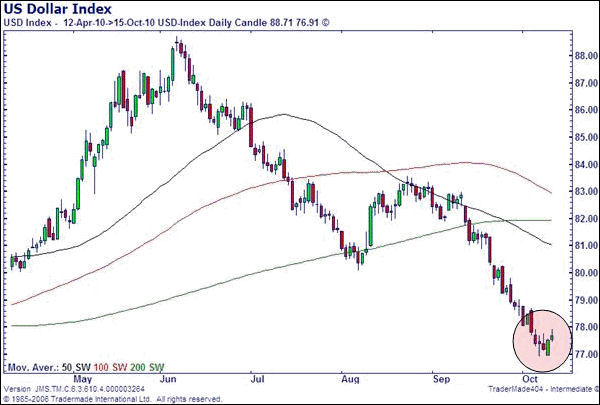
The US Dollar index also appears to be building up some area of support around the 76.90 area, close to the lows this year which are around 76.60.
The daily candlestick charts are also flashing some warning signs with a hammer and a bullish engulfing pattern on the charts over the past 3-4 days. A weekly close above 78.15 on the US Dollar index would also signal a weekly bullish candle and could well set-off a sharp rally as we head towards the FOMC meeting on the 3rd November.
Given the fact that the US Dollar has fallen so far there is a question mark about how much new easing is priced in with estimates of between $500bn and $1tn.
The single currency has been one of the main beneficiaries of the weakness of the US Dollar, so much so that despite its own problems it has managed to rally over 1,000 points in the space of a month.
However there is some evidence that this move may start to run out of steam temporarily even if some longer term technical indicators look as if they may turn bullish.
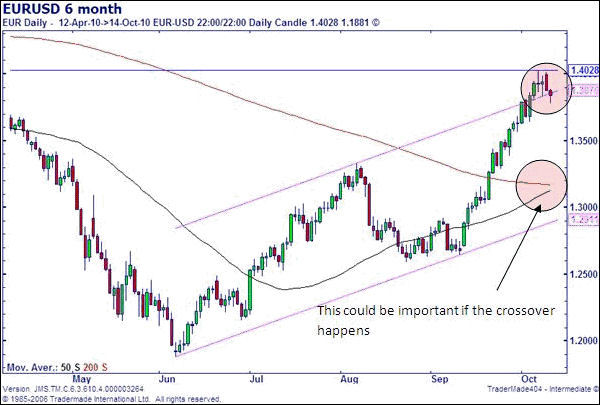
A bearish engulfing daily candle combined with some long shadows has the potential to signal a broader correction back towards the $1.3510 area in the near term.
However with the 50 and 200 day moving averages both looking positive and set to cross, there is a possibility of a “golden cross” crossover occurring in the coming days and weeks.
However, care does need to be exercised and, given that the US Dollar index crossover happened last month, ideally we would like to have seen a correlative crossover.
If the crossover does happen it would be quite a bullish signal and could well propel the Euro above the $1.4030 double top resistance towards $1.4500.
Spread betting and CFD trading carry a high level of risk to your capital and you may lose more than your initial investment. Spread betting and CFD trading may not be suitable for all investors. Only speculate with money that you can afford to lose. Please ensure you fully understand the risks involved and seek independent financial advice where necessary.