In this brief analysis, we will first discuss what Elliott Waves and Stochastics are and how to interpret them and then we will move on to an example of how they can be used together.
Elliott Waves
The social principles underlying Elliott Waves were first documented by the professional accountant Ralph Nelson Elliott in the 1930s.According to Elliott Wave Theory, every action in the market is followed by a reaction. The theory suggests that these actions and reactions form recognisable wave patterns that can be picked up and used to the advantage of a professional trader.
Elliott Wave theory states that a trend consists of five waves in the direction of the trend, and three smaller waves in the opposite direction.
The three smaller waves form the market reaction to the general trend and serve as a correction of price levels. In an uptrend, they are usually the result of profit taking when investors cash in on their ‘winnings’.
In a downtrend, we have a reversal of the situation with five downward waves, called impulses or motive phases, and three reversal or corrective waves.
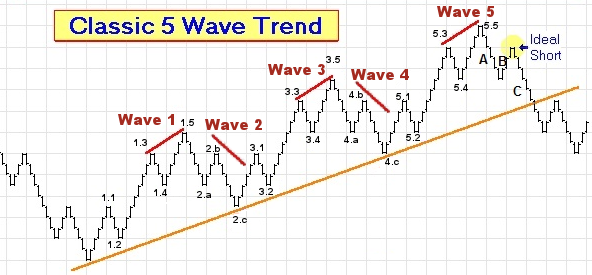
The bar chart below shows an example of a typical Elliott Wave. Note that Waves 1, 3, and 5 follow the main trend, which is upwards in this case, whilst Waves 2 and 4 are corrective or reversal waves.
Probably the trickiest part of Elliott Wave Analysis is determining when a new cycle has started. At the beginning of a new uptrend, the market usually still seems to be in the grip of a bear phase and many traders therefore miss the first ‘leg’ of the Elliott wave.

Stochastics
The Stochastics indicator is an oscillator and a momentum indicator, with clear levels of support and resistance, and is widely used in various forms of technical analysis.The term ‘stochastics’ is a reference to a market instrument’s current price in relation to its average price range over a certain time period. The system tries to predict the future price by comparing the current price to the price range over the period in question.
A typical graphical representation of the Stochastics indicator usually consists of two lines:
%K is the actual Stochastic and is therefore usually displayed as a solid line
%D is normally displayed as a dotted line and is a moving average of the actual Stochastics.
Spread Betting with Stochastics – Case Study
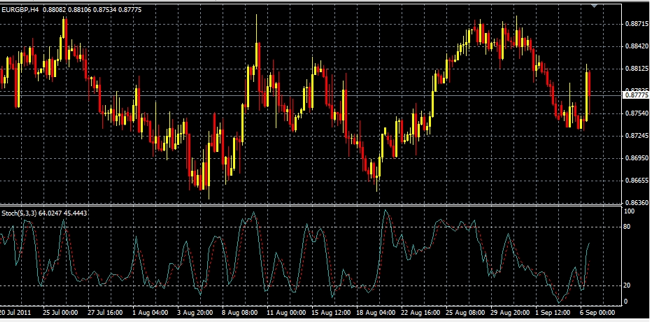
The chart below is a 4-hour candlestick chart of the Euro – Sterling spread betting market from July to September 2011 with the corresponding Stochastics indicator shown below the price chart.There are several ways of using stochastics to aid your decisions when considering a trade.
One method is to watch for points at which the two lines cross. In the case of the candlestick chart below, a trading signal is generated when the faster %K stochastic line crosses the slower %D line on the 6th of September 2011. Here a buy signal was triggered by the upwards crossing of the %K line through the %D average.
A different approach is to wait for the %K or %D line to go above 80 or below 20. These are considered to be ‘overbought’ and ‘oversold’ areas respectively. If the oscillator should, for example, go above 80 then the theory suggests that an investor wait for it to turn around and drop through the 80 level before going short.

Combining Elliott Waves with Stochastics
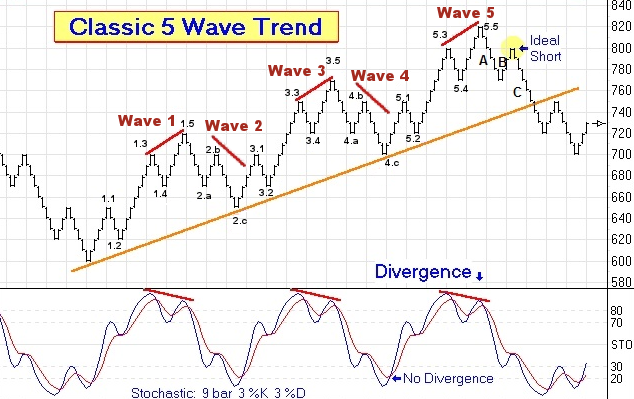
Below we can see a theoretical chart with both Elliott Waves and the Stochastics indicator displayed simultaneously.What will be immediately apparent is that there is a remarkable level of agreement between the pictures portrayed by the two indicators.
During the first sub-wave of the first main Elliott Wave, marked 1.1 on the chart, we see the Stochastic move from below 20 to 70.
When corrective sub-wave 1.2 occurs, the Stochastic shows a small decline, but note that it still remains above 50.
The next upwards sub-wave or impulse of the Elliott Wave, marked 1.3 on the chart, sees the Stochastics move to a level well above 80.
By now, we can see that an astute trader could use a combination of these two indicators to improve his chances of success.
A good entry point for a short trade will be at the point marked as ‘ideal short’ on the chart towards the end of this trend. At this point, we are seeing the beginning of a new downward cycle of Elliott Waves.
By this time, the Stochastics has also dropped far below the 80 level and both the %K and %D lines are heading downwards.
Since it is difficult to correctly predict the onset and direction of a new Elliott Wave cycle in a spread betting market, a staggered approach is perhaps in order here. Enter into a relatively small short trade at the point marked ‘Ideal Short’ and then ‘build on’ the trade by adding short contracts as the trade progresses.
With an Elliott wave, one will usually see a corrective ABC wave pattern at the end of a major trend.
After a bull run we will, for example, see a first, relatively small, downwards wave A, followed by B, which will be in the same direction as the now defunct bull run.
By the time the second downward wave C hits the market, the majority of traders will realise that a bear market has started to develop.
With the above approach, you will enter the trade at the end of the corrective wave B and just before the large downwards wave C starts.

Technical Analysis Theory
For more articles looking at technical analysis see:- Index Spread Betting Strategy
- Combining Technical and Fundamental Analysis
- Spread Betting and Channel Trading
- Managing Spread Betting Positions
- Designing Your Own Trading System
- Introduction to Elliott Waves
- Elliott Wave Patterns and Trading Analysis
- Advanced Elliott Wave Trading Analysis
- Guide to Ichimoku Clouds
Good luck and happy trading
Shai Heffetz, InterTrader
(Original article written 07 September 2011).
Spread betting and CFD trading carry a high level of risk to your capital and you may lose more than your initial investment. Spread betting and CFD trading may not be suitable for all investors. Only speculate with money that you can afford to lose. Please ensure you fully understand the risks involved and seek independent financial advice where necessary.
