This article covers advanced corrective wave patterns in Elliott wave analysis.
For a more fundamental introduction to Elliott waves please also see:
Elliott Waves: Zigzags, Flats and Triangles
When a financial spread betting market starts moving against the main trend it often does so only with a substantial degree of effort.This is why one would normally see a movement in the direction of the trend, i.e. an impulse wave, to be clearly distinguishable. This is not always the case with waves that move in the opposite direction, i.e. corrective waves.
It comes as no surprise, therefore, that one finds a wider variety of corrective waves than impulse waves.
Elliott wave analysis usually places corrective waves into four categories, Zigzags, Flats, Triangles and Combined Structures.
Each of these categories can come in a variety of forms. For example, a zigzag can either be a single, a double or a triple.
A flat can either be a regular, an expanded flat or a running flat, while a triangle can take four forms; an ascending or descending triangle or a contracting or expanding triangle. Combined structures usually come in groups of double-threes and triple-threes.
Elliott Waves: Zigzag Waves
The first chart below is an example of the simple zigzag corrective wave that one would expect to see in a bull market.It is a simple three wave pattern with the top of wave three being noticeably below the starting level of wave A.
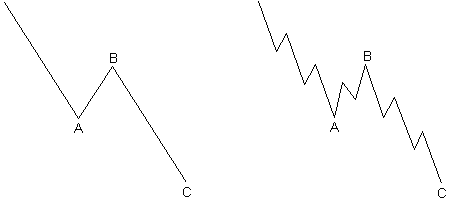
The right hand chart above is an example of what a zigzag might look like in real life when you are conducting your technical analysis.
Here, waves A and C consist of five sub-waves each, three of which are in the direction of the main trend and two against the trend. Wave B consists of three sub-waves.
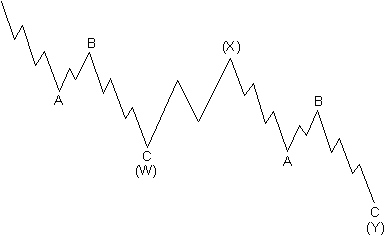
Now and again a zigzag will occur more than once. A double zigzag is not uncommon, but it is very seldom that one sees a triple zigzag pattern.
This mostly happens when the first zigzag does not meet its target. The chart below shows an example of a double zigzag pattern.
Elliott Waves: Flats
A flat corrective wave differs from other corrective waves in that the sub-wave pattern is 3-3-5, as can clearly be seen in the chart on the right.The first actionary wave, wave A in both charts above, does not have enough downward force to develop into a five-wave pattern such as we have seen earlier. Instead it forms a three sub-wave pattern, as shown in the right hand chart below.
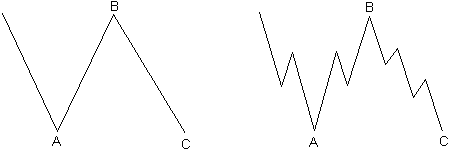
The corrective wave B appears to inherit this uncertainty and it ends near the starting point of wave A. Wave C also lacks sufficient force to go far below the bottom of wave A, so what we see is a pattern such as in the two charts above.
Flat corrections normally do not retrace the same amount as their zigzag counterparts, instead they nearly always follow or precede extensions.
The stronger the underlying trend, the shorter the flat would normally be. It is not uncommon to find flats in the fourth, corrective, wave of a five wave Elliott wave pattern.
Elliott Waves: Expanded Flat Corrections
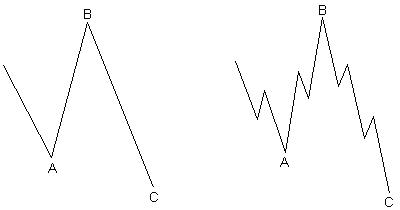
What we can see in the two charts above are called regular flat corrections, however, an expanded flat correction is actually more common.Examples of the latter can be seen in the two charts below.
In both cases, wave B ends well above the starting point of wave A, but wave C is strong and therefore ends well below the termination point of wave A.
Elliott Waves: Triangles
Triangles seem to be a reflection of a balance in the marketplace, so it comes as no surprise that they cause a sideways price movement, usually associated with decreasing volatility and volume.A triangle consists of five overlapping waves that can, in turn, each be subdivided into three sub-waves.
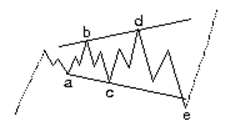
The triangle is formed when we connect the ending points of waves (a) and (c), and the ending points of waves (b) and (d). Wave (e) can, and often does, overshoot the (a-c) line.
There are two types of triangles, expanding and contracting. While there is only one type of expanding triangle, there are three types of contracting triangles: ascending, descending and symmetrical.
The chart below is an example of an expanding triangle.
Elliott Waves: Ascending, Descending and Contracting Triangles
The charts below are, respectively, examples of ascending, descending and contracting triangles.
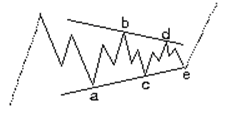
In the first chart, one can clearly see the ascending bottoms, while the tops remain flat.
The second chart is characterised by descending tops, with the bottoms remaining flat and in the final chart we have both descending tops and ascending bottoms.
In unusual circumstances, we might see the second wave in a five wave Elliott pattern take the form of an impulse. However, it is much more common for this to happen in wave four, which is the corrective wave just before the final actionary wave.
More Elliott Wave Guides
For more articles looking at financial spread betting and Elliott wave analysis please see:- Introduction to Elliott Waves
- Elliott Wave Trading Analysis
- Combining Elliott Waves with Stochastics
Spread betting and CFD trading carry a high level of risk to your capital and you may lose more than your initial investment. Spread betting and CFD trading may not be suitable for all investors. Only speculate with money that you can afford to lose. Please ensure you fully understand the risks involved and seek independent financial advice where necessary.
