A more technical look at the markets from InterTrader
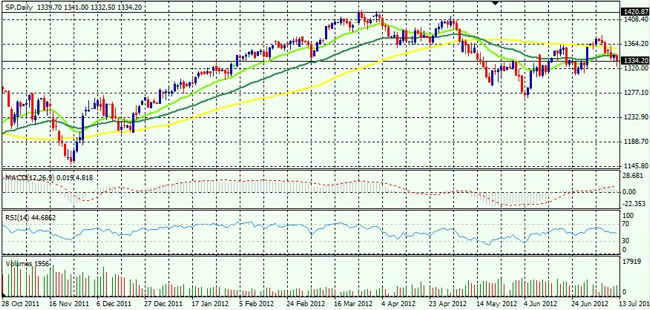
After a drop at the end of May that sent the S&P 500 back to the December 2011 highs, the US index moved higher and is currently trading in a tight range between 1.330-1.375.
To this writer, the risk is clearly to the downside given that:
- The US economy is continuing to weaken
- Corporate earnings are showing clear signs of strain
- The Eurozone debt crisis is still raging
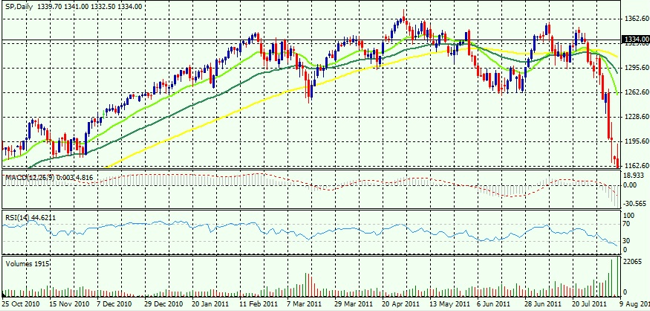
If we take into consideration what happened last summer, there are quite a few similarities.

S&P 500 Analysis: 2011 Chart

S&P 500 Analysis: 2012 Chart
In both cases, the market rallied in June, following a May decline, leading to sloppy sideways trading in July.
The major sell signal was triggered on 4 August 2011, when the market started to freefall.
With the current fundamental and technical setup showing a downward trending market, the S&P 500 index could soon re-test June lows in the 1.273 area, if not set new lows in August.
Should those lows coincide with further weakness in the economy, that would provide the Fed with grounds to launch a third QE.
If, however, the Fed acts earlier, we should consider adding equity exposure back into our portfolios.
Good luck and happy trading
Dafni Sedari, InterTrader
(Original article written 26 July 2012).
Spread betting and CFD trading carry a high level of risk to your capital and you may lose more than your initial investment. Spread betting and CFD trading may not be suitable for all investors. Only speculate with money that you can afford to lose. Please ensure you fully understand the risks involved and seek independent financial advice where necessary.
