A more technical look at the markets from InterTrader
The GBP/USD has been trading upwards in August and is currently hovering just below the key resistance level at $1.5693, supported by modestly encouraging UK job data in the three months through June.
FX spread betting markets have been recently pricing in more monetary easing to aid an economy struggling in deep recession.
However, MPC members voted 9-0 not to add to the asset purchase program again after the BoE had already engaged in an aggressive expansion of its balance sheet.
As the effects of further QE for the real economy are at least questionable, a second round of aggressive intervention looks less and less likely.

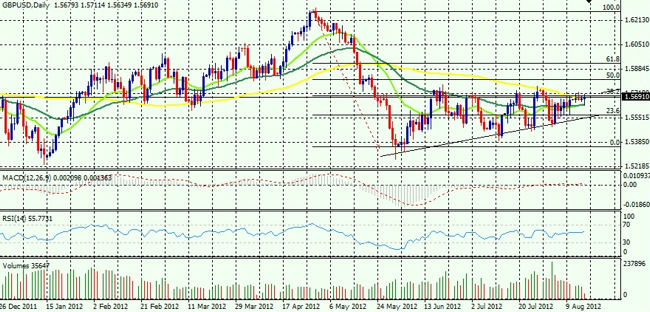
GBP/USD Forex Chart
From a technical point of view, the market is starting to run into massive resistance at $1.57 with the bulls exerting upward pressure.
At the time of writing, cable is at $1.5693 and hovering around the 38.2% Fibonacci retracement level from May’s high to June’s low.
A break to the upside could push cable further up to test the 50% Fibonacci level at $1.58.
Recently there is a bullish alignment of the 20 EMA over the 50 EMA on the daily spread betting chart. The MACD signal line that has just crossed above the zero level and a stable RSI above 50, further support a bullish scenario.
The key support level on the downside sits at $1.55.
A break below this level could trigger a downward movement all the way back to June’s low at $1.5340.
Click here for more information on forex trading.
Good luck and happy trading
Dafni Sedari, InterTrader
(Original article written 16 August 2012).
Spread betting and CFD trading carry a high level of risk to your capital and you may lose more than your initial investment. Spread betting and CFD trading may not be suitable for all investors. Only speculate with money that you can afford to lose. Please ensure you fully understand the risks involved and seek independent financial advice where necessary.
