A more technical look at the markets from InterTrader.
Crude Oil Bull Market Analysis
Brent Crude reached a low of around $77 a barrel at the end of May 2010. Since then it has been steadily climbing until it reached a high of $119.40 on 24th February 2011. On that particular day trading was very volatile and the price retreated to close at $110.30.Since then, the crude oil spread betting market touched a high of $118.47 on 7th March and afterwards started retreating somewhat, until it reached a low of $108.04 on 15th March. The price then recovered some lost ground and at the time of writing, 24th March, it was trading at $115.60.
There are several fundamental and technical factors driving the price at present.
Fundamental Factors
The increase in the price of Brent that we have seen since May 2010 was largely driven by demand from large economies, such as China and India, along with other countries in that region, e.g. the Philippines.If a recovery takes place in the major economies of the West over the medium term, this will put further upwards pressure on the price.
Since the unrest in Middle East/North African (MENA) countries started in February, we have seen a sharp spike in the price of Brent. This was, to a certain extent, an over-reaction to the situation in these countries, more based on the fear of a disruption in supply than actual facts on the ground.
On 11th March there was a catastrophe that hit the word’s third largest economy when a massive earthquake caused a tsunami that destroyed entire towns and villages in the northeast of Japan. Fears of a recession in that country immediately caused the oil price to start dropping significantly.
As the extent of the damage becomes clearer and the rebuilding process begins, events in Japan could actually stimulate the economy of that country, along with those of its major trading partners. This will result in renewed demand for the commodity, which will further add upward pressure on the price.
Technical Factors
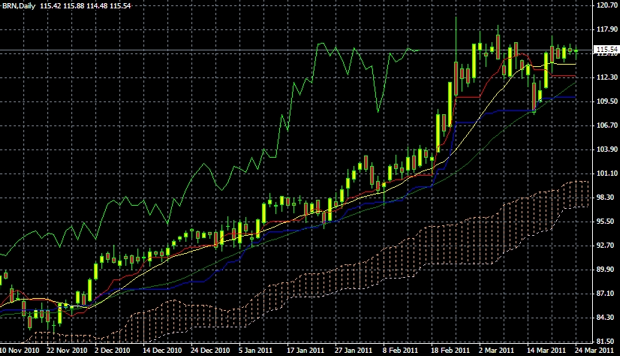
Looking at the technical analysis, since the 14-day moving average (yellow line in graph below) moved above the longer term 28 day moving average (dark green line) on 3rd December 2010, it has never crossed below it again. The price, however, closed slightly below the 28 day moving average on 15th March, which would have indicated a turning point if it did not recover subsequently.The price has since moved above the 14-day moving average (yellow line) again, indicating that the previous upward movement has been restored.
The Ichimoku Kinko Hyo is still clearly indicating a bull market, with the price well above the cloud. The Chinkou Span (light green line) is also above the price, which confirms the bull market is intact. Further confirmation is provided by the red Tenkan Sen line, which is still running above the blue Kijun Sen.
A cautious trader would wait for the price to break through the 7th March high of $119.40 before committing to a long trade. First level of support would be the red Tenkan Sen line. If the price breaks down through the blue Kijun Sen, I would definitely be out of the trade, but if you have a longer-term view of the market, the final support level is the upper border of the Ichimoku cloud. Under present circumstances going short on a medium term trade in Brent is only advisable if you are privy to information nobody else has.
Day traders, of course, work with shorter time frames. Although the Ichimoku Kinko Hyo was specifically developed to pick up longer-term trends, many traders also use it for day trading, although it becomes less reliable in extremely volatile markets. Hourly or even fifteen-minute charts are more useful if you are involved in day trading.
Bull Market Chart Analysis

Good luck and happy trading
Shai Heffetz, InterTrader
(Original article written 30 March 2011).
The contents of this report are for information purposes only. It is not intended as a recommendation to trade. Neither InterTrader nor CleanFinancial.com accept any responsibility for any use that may be made of the above or for the correctness or accuracy of the information provided.
Spread betting and CFD trading carry a high level of risk to your capital and you may lose more than your initial investment. Spread betting and CFD trading may not be suitable for all investors. Only speculate with money that you can afford to lose. Please ensure you fully understand the risks involved and seek independent financial advice where necessary.
