Losses can exceed deposits
CMC Markets have improved the charting on their Next Generation spread betting platform.
Video Guide to CMC Markets Charts
This short video takes a look at the charting package and covers a number of key features and functions.CMC Markets Charting, Tools and Features
Spread betting investors can now benefit from the following new Charting features:Charts – More Flexible Layouts
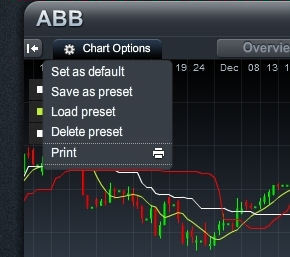
You can now save your preferred trading chart settings.
So, when any new fact sheet is opened the charts will appear with your unique preferences.
E.g. Mid price candlestick chart, 1 Day, 6 Months chart with MACD, Chande K and WMA 10 technical tools open.
Zooming Lock
Many spread bettors like the zoom functionality CMC Markets currently has, but if you prefer the interval to stay constant, CMC have now included the option to lock the interval when scrolling.Each period will have a maximum zoom area (e.g. 1 Day is approximately 1 year worth of data), but now you can zoom in to the latest 5 to 10 candle within this time interval.
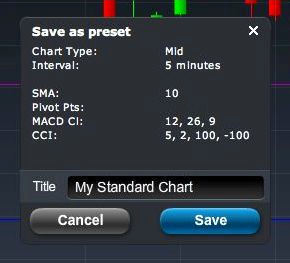
Set Chart Parameters as Saved Presets


CMC Markets Charts – Increased Data Points
CMC Markets Charts – Decreased Chart Box
CMC Markets have decreased the minimum Fact Sheet size so you will have more available workspace should you require it.Spread Betting Charts – Tools and Studies
New Chart Drawing Tools:
- Add text to charts
- Fibonacci Price Extensions
- Fibonacci Fans
- Fibonacci Arcs
- Fibonacci Speed
- Fibonacci Time Extensions
- Fibonacci Cycles
- Buy and Sell icons
- Arrows
- Triangles
- Rectangles
- Ovals
- Vertical Line
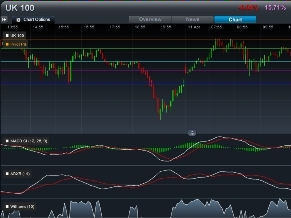
New Chart Technical Studies:
- Ichimoku Cloud
- Pivot Points
- Redesign of MACD with histogram
Candlestick and OHLC Chart Types
CMC Markets account holders can now choose these chart types based on Buy & Sell prices rather than just the mid-price.Customising Tools for Studies
- CMC Markets spread betting account holders can now change the overbought and oversold levels on indicators
- Show maximum 3 studies at the bottom of the chart instead of the current 2
Enhanced Charting Features – Dynamic Line
See where the current price is relative to historical price movements. The dynamic line shows a horizontal line across price action at the current market price. When the last tick was up the value will be green, when the last tick is down the value will be red.Enhanced Charting Features – Print Charts
You can now print a copy of your chart analysis showing price history, technical studies and drawing tools that are currently in view.Spread Betting Charts – Value Box
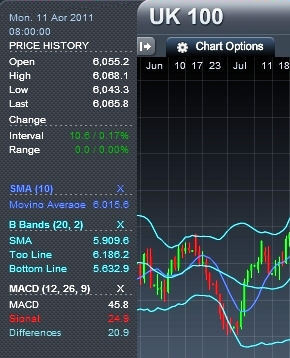
Now you can easily view price and technical values. The value box will automatically appear when you select the crosshair function or can be manually opened/closed using the- Price History now includes Open, High, Low and Last (of selected time period)
- Price and Percentage Change Values
Crosshair Selected
- Interval = Current change in the interval selected
- Range = Change between closing price of interval selected and the current market price
Crosshair Not Selected
- Interval = Current interval change
- Range = Value will be zero
When you have Technical Studies or Overlays selected the value box will show the current values of these indicators.
Each value is colour coded and named so clients can easily see which line represents what value.
If the Cross hair function is selected the Value Box will show the Price and Technical calculations of the period selected.
Updated Spread Betting and CFD Charts
With the upgraded charting package investors can now:
- Fully customise chart settings, technical studies, drawing tools and overlays.
-
Save all their technical analysis via the watchlists. Previously when a chart was closed and re-opened it was reset and any drawing tools added during the analysis were removed. With the new charts all work is saved when charts are closed.
(Note that charts will not be saved if they are opened and closed through the Product Library).
- View double the number of data points which means twice as much price history and in some cases up to 20 years of price history.
- Identify common patterns such as head and shoulders, triangles and more than 60 other candle stick patterns.
- View charts in full screen mode as well as with white backgrounds.
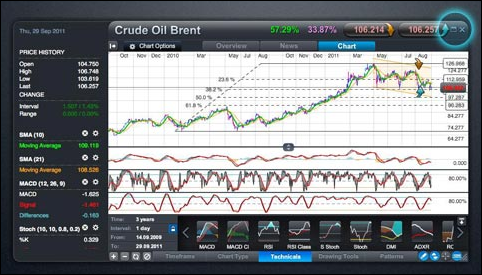
CMC Markets Charting
CMC Markets have also added other enhancements to their charts such as:- 2 minute charts, 10 minute charts and monthly charts.
- New technical overlays including Supertrend and Donchain Channels.
- New Heiken Ashi Charts.
- ‘Your Default Settings’ – CMC have increased the options in the persistence code to include crosshairs and dynamic lines.
CMC Chart Upgrades
Below, November 2010 Chart Upgrades.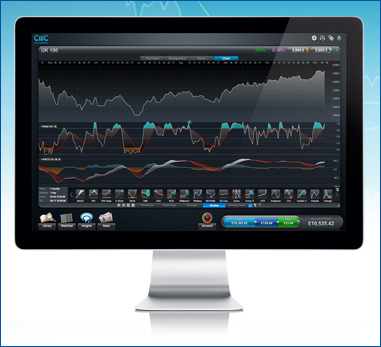
Peter Cruddas, Executive Chairman of CMC Markets, said: “We think that the new charting package is so powerful that traders won’t ever have to pay for additional charting software.
“The functionality is excellent with over 60 customisable technical indicators and overlays, but what really makes it stand out is the usability and design.”
The introduction of new candlestick charts and tools is the latest upgrade from CMC Markets. They launched their next generation spread betting platform just several months ago in July.
“Our clients can place trades, track markets, add indicators and overlays, monitor positions and edit orders directly from charts. In addition, charts can be adjusted by time frame, interval or date range to view the last five years of price history for each instrument,” Cruddas added.
The trading charts package is available on both the live and the demo platforms, meaning users can try out the charts before they sign up, and include:

- Overlays: A range of 21 different overlays including Bollinger Bands, Moving Averages, Parabolic SAR and many more.
- Technical studies: 46 new technical studies including, but not limited to, Stochastics, RSI, and MACD.

- Drawing tools: Tools that allow you to draw your own trend lines, Fibonacci Retracements, channels and much more.
- Timeframes: The timeframe tool lets users view charts in a range of timeframes, from minutes to years.
It is however important that you remember that spread trading is a leveraged product and you can lose more than your initial deposit.
Want a CMC Account?
Losses can exceed deposits
Spread betting and CFD trading carry a high level of risk to your capital and you may lose more than your initial investment. Spread betting and CFD trading may not be suitable for all investors. Only speculate with money that you can afford to lose. Please ensure you fully understand the risks involved and seek independent financial advice where necessary.

